Since 2020, the working world as we know it has been in a constant state of rapid evolution. Whether it be macro-economic, social, or political pressures that are causing these seismic shifts, corporate leaders face a fundamental change in the way we work. Talent management and workforce planning are more critical than ever.
As work becomes increasingly distributed, there is a growing disconnect between employees and leadership. According to Deloitte’s recent 2023 Global Human Capital Trends report, nearly half of the respondents indicated that their organization’s leaders are overwhelmed and struggling to identify what they should prioritize in a new world of work. Meanwhile, 85% of leaders say that the shift to hybrid work has made it challenging to have confidence that employees are being productive.
85% of leaders say that the shift to hybrid work has made it challenging to have confidence that employees are being productive.
Traditional sources of employee data like HRIS systems, engagement surveys, and town halls don’t provide the timely, unfiltered insights that are critical to enabling employee engagement and success in today’s environment. In fact, 40% of U.S. HR leaders cited “HR insights and data analytics” as a top concern.
Talent management in the modern workplace
To better understand the challenges associated with analyzing your workforce, we spoke to Stuart Robertson, who joined AvePoint in 2021 as Chief People Officer (CPO) before moving into his current role as Chief Operating Officer.
Q: Hi, Stuart. Thanks for joining us today! Can you start by sharing a bit about your role?
A: Happy to be here. I’m speaking to you today from my perspective as a Chief People Officer, though my role at AvePoint has evolved to Chief Operating Officer. Today’s CPOs increasingly come from a talent management background. Historically, HR leaders more typically came from an operational background and worked their way up through HR operations. These days, the profile of a CPO is much more strongly oriented toward talent management because that experience will ultimately create value in an organization. It is what the discussion with one’s corporate board is often about.
Q: You mentioned this idea of constant change, having to stay ahead of the game. How do you know? How does an organization measure engagement?
A: At AvePoint, we recently did an employee engagement survey using a platform that provides instant feedback. That feedback is fixed though, it’s just a point in time. The biggest challenge companies have with engagement surveys is that there’s a difference between how people say they are and how they really are.
Of course, we take steps to ensure honest responses, like sending the survey through a confidential third party. We craft questions hoping for as much feedback as possible, but the best you can hope for is the start of a conversation.
Q: What are your sources of data?
A: That’s constantly changing. Organizations with a simpler infrastructure typically look at their Human Resources Information System (HRIS) data to see turnover rates, how many people are leaving within their first 12 months of employment, and “regrettable turnover vs. involuntary turnover.” Then, we can layer in commercial data, particularly when you’re onboarding new salespeople. How quickly are they becoming productive? How productive are they? How engaged are they? We’ll look at those three things together.
We can dive even deeper into that commercial data by looking at revenue per full-time employee (FTE), benchmarking, and efficiency metrics. These are all very macro, though. They might suggest an area to explore further but don’t really allow you to draw conclusions.
Q: You’ve been in the business of people for a while now. What changes have you seen in the industry?
A: When I came to the U.S. in 2009, it was a completely different world. We could wrap our hands around this stuff, we could see it all, organize meetings, etc. Lately, work has exploded exponentially. Even if you were to do an engagement survey once a month, you wouldn’t have time to debrief on the results, much less act on them, before things changed again.
If all you have are lagging indicators, you’re at a disadvantage. If you’re reacting when you see it, it’s too late.
Q: If you could see teams’ engagement and performance in real-time, how would you use that information?
A: A challenge as a CPO is that you see things being spoken about in random conversations, then you go out there and try to get your finger on the pulse of what’s going on internally. This only gives you a certain level of insight.
If I had data that could tell me how certain messages are landing, what teams are talking about (not in a Big Brother way), where collaboration is thriving, and where there might be red flags, that would give me exactly what I need to know.
Q: CPOs themselves have had to evolve with this digital world. Can you speak to that?
A: Sure, that’s certainly true. As technology and collaboration have changed over the past few years, CPOs have had to adapt and find new ways to drive value and stay relevant in this evolving organizational landscape.
If a CPO could get their hands on leading data indicators, they would be well ahead of the game and allow them to avoid a potentially costly pitfall. It’s because leadership doesn’t know what’s going on that they might consider monitoring employees rather than employee insights. I believe that’s one of the biggest risks to the future of work.
For managers who are wondering whether their remote or hybrid teams are being productive, I’d ask them, “When you were in the office 5 days a week, did you stand over them looking at what they’re doing?” No, of course not — but you did have more conversations and more interaction. If we had internal data that helped us see the conversations that we might be missing because we’re remote, it would fill in that missing piece of the puzzle that people are feeling but don’t know how to solve for.
Enabling conversations with tyGraph’s workforce analytics
tyGraph, a leader in the employee experience and workplace analytics space, empowers human resources and talent management teams to modernize the way they engage with and analyze their workforce.
Now an AvePoint company, tyGraph’s purpose-built solutions analyze employee sentiment, engagement, collaboration, and productivity across the ecosystem where they spend most of their time — Microsoft 365. This expanded data set has become a critical resource as organizations evaluate key business and workforce decisions.
Let’s take a look at some of the ways HR leaders can use insights to an organization’s advantage:
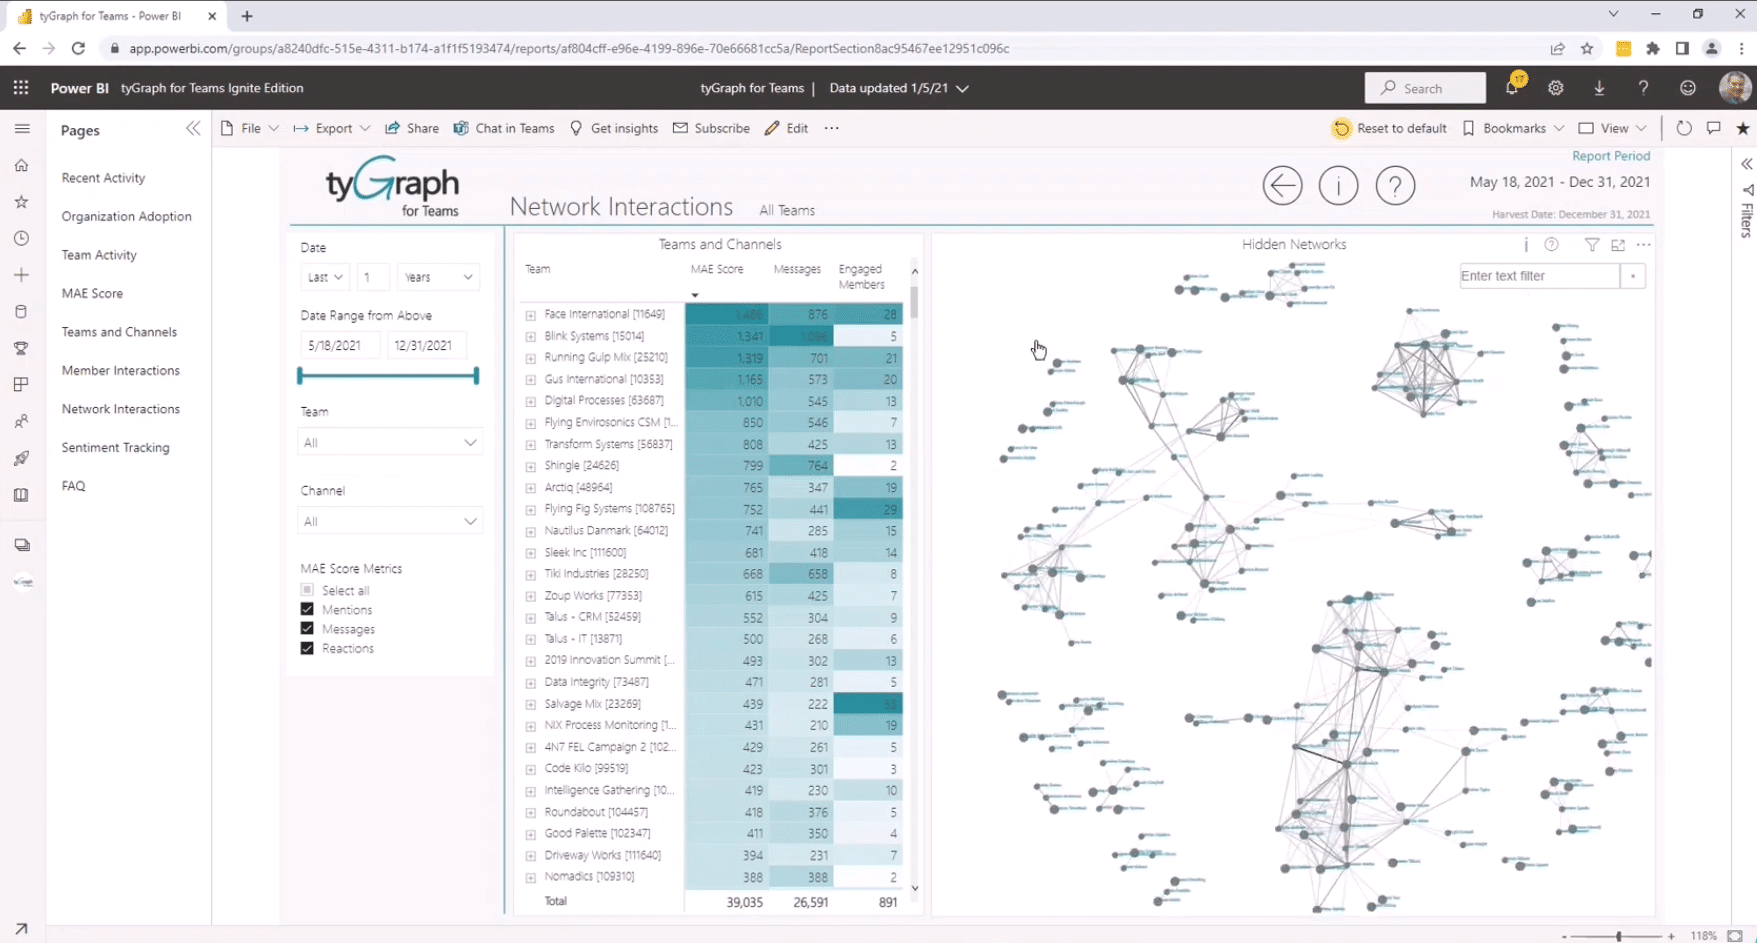
1. Get to Know Your Network
With hundreds of thousands of messages flooding Microsoft 365, it’s simply impossible to measure this data manually. tyGraph analyzes interactions between teams and channels within your Microsoft 365 ecosystem to see how teams and employees are engaging with one another.
The Network Interactions dashboard allows people leaders to segment the data by Community, Channel, or HRIS dimension (think region, department, etc.) to find out which pockets of users are highly engaged, who’s sitting on a virtual island, and who’s at the center of the action.
Organizations can also use employee engagement data to support change management or retention efforts. Imagine you recently completed an acquisition—an expensive and labor-intensive investment that requires you to demonstrate value within a certain timeframe. If you had a way of knowing whether incumbent and acquired teams were working well together, you’d have a chance to course-correct before it impacted the deal’s success.
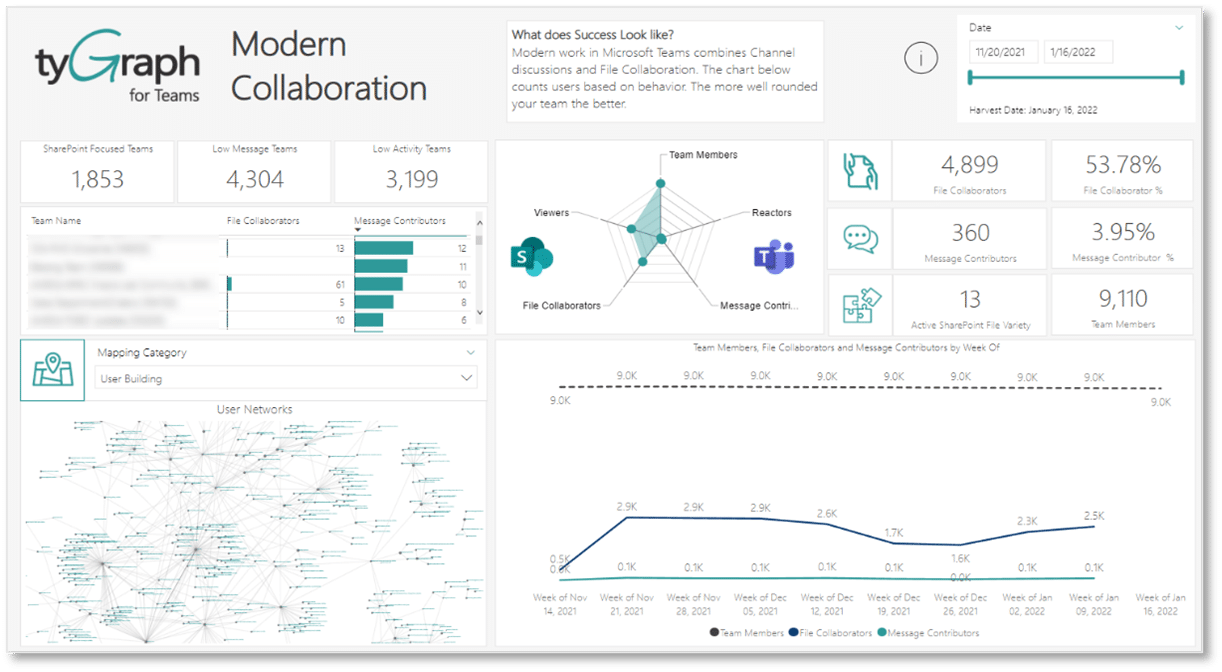
2. Drive Collaboration Across a Distributed Workforce
Using tyGraph’s Modern Collaboration dashboard, leaders can see if there are teams operating in siloes, whether employee engagement is suffering, and more. Workplace analytics is not a Magic 8 ball. Rather, it shows leaders the shape of the work that’s happening — a sense of whether collaboration is thriving or where people may not be so connected.
Forty-two percent of business leaders expect that, over the next two to four years, technology will help drive better organizational outcomes by nudging workers and teams to perform better. For human resources managers, employee analytics plays a critical role in guiding their talent management strategy and achieving performance and retention goals.
3. Employee Sentiment
One of the challenges of today’s hybrid or distributed workforce is the lack of context. You can’t simply look across the office to gauge the general mood. tyGraph’s Employee Sentiment dashboard helps managers bridge that gap. Using artificial intelligence to score the sentiment of each message sent through Teams, tyGraph then plots those scores over time to provide a trend analysis.
![]()
Not only do these insights serve as a way to keep a pulse on the biorhythm of the organization, they enable human resources leaders to identify specific factors that may be negatively or positively impacting sentiment and that may require attention. By using artificial intelligence to analyze data from a particular time frame, tyGraph identifies specific factors (“key influencers”) and the probability that they’re causing sentiment to trend upward or downward.
See your employees, don’t watch them
One of the most important discussions in the world of employee analytics is about “monitoring.” At AvePoint, we believe that organizations must operate in a manner that maintains the trust of their workforce. tyGraph’s analytics present summary-level, obfuscated data that does not reveal employee-specific Personal Identifiable Information (PII).
From a tactical standpoint, there’s not much value in measuring the activities of one employee. The real value comes from following the trends at a regional, departmental, or team level. By benchmarking sentiment or getting clues as to why one team might be more productive than another, people leaders can take action to improve employee and organizational outcomes — without compromising their organization’s integrity.
Tech-savvy HR needs to step forward
Now more than ever, people teams must help their organizations balance employee interests with organizational success. Workforce analytics do not provide a magic fix to the complexities of the modern workplace, but they do empower leaders with critical insights into areas where the organization is thriving and areas that may need some attention. With reporting in hand, it’s then up to Human Resources to put insights into action.
Today’s HR leaders must be able to augment their talent management experience with a mastery of employee analytics, and parlay that combined knowledge into strategic business outcomes. In other words, “tech-savvy HR needs to step forward.” According to a recent PwC survey, HR’s ability to navigate the tech landscape is a top “at risk” capability. While 41% of HR leaders are confident that their departments are up to speed in this area, only a quarter of business leaders agree.
Further, the survey suggests that companies are struggling to use data and advanced analytics to make decisions about their workforce. Not only do employee analytics have the potential to improve satisfaction, collaboration, and performance, they can also help foster new behaviors and guide strategies that help employees become better versions of themselves.