
In today’s age of digital transformation, data analytics plays a critical role in shaping how leaders form business decisions. A Gartner study found that by 2023, more than 33% of large organizations will have analysts practicing decision intelligence for their business strategies.
To make this vision work, analytics teams must bridge the gap between analytics and insights — providing the right context of data that makes sense to their users. The benefit of business intelligence is that analytics teams can create digestible and actionable reports that resonate with their stakeholders and business leaders.
Power BI can do just that.
What is Power BI?
One of the Power Platform fundamentals, Power BI is Microsoft’s business intelligence platform for creating and sharing immersive data visualization.
Power BI empowers users with coherent insights and reports by seamlessly connecting multiple data sources — making it possible to gather and sort valuable information and turn it into digestible reports and dashboards.
Backup and recover your Power BI workspaces with
AvePoint Cloud Backup.Learn More
The core elements of Power BI
Power BI has three core elements where you can access the platform:
- Power BI Desktop
- Power BI service
- Power BI mobile apps
Power BI Desktop
Power BI Desktop is where the magic usually starts.
It’s a Windows desktop application that you download and where you can begin analyzing your data and building your reports.
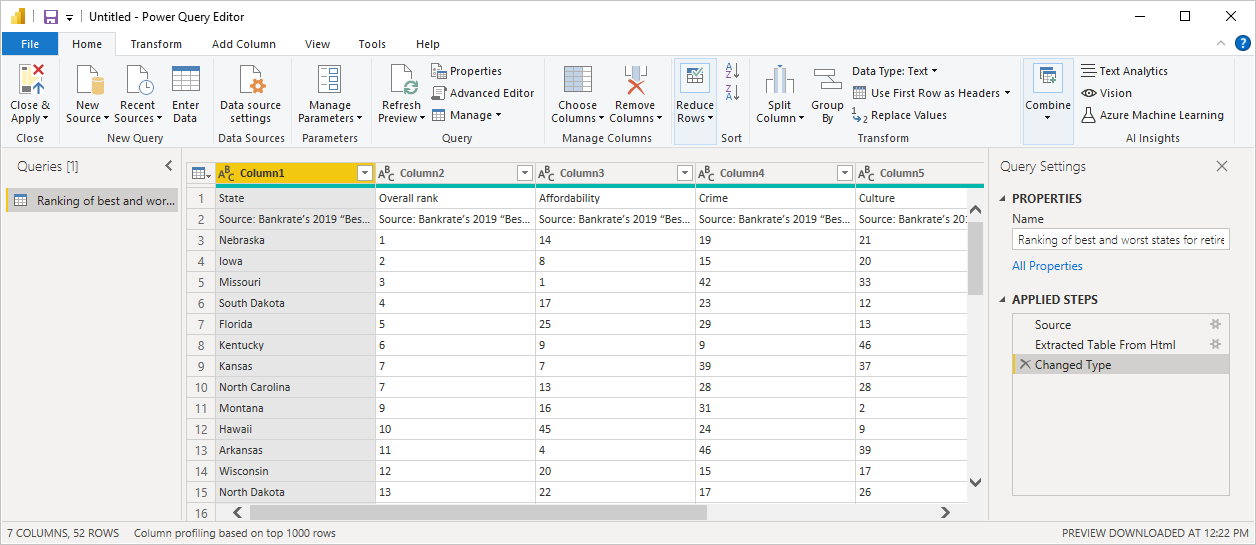
Within Power BI Desktop is the Query Editor, which connects your Power BI to multiple data sources (including Microsoft Dataverse). It lets you combine data from the sources to create your data models — and then eventually build your reports based on those models.
Once you’ve designed your reports in Power BI Desktop, you can share them with others or publish them to the Power BI service.
Advance your management and governance of Power BI with
AvePoint EnPower.Learn More
Power BI Service
Power BI service is a cloud-based or software-as-a-service (SaaS) platform supporting report editing and collaboration.
Similar to Power BI, Power BI service also allows you to connect to data sources and build data models, although with more limited capabilities. The true power of Power BI service, however, is in remodeling, collaborating, and sharing your reports to create engaging dashboards to showcase your relevant business insights.
Power BI mobile apps
You can then access your built reports and dashboards — whether in the cloud or on-premises — with Power BI’s mobile apps for Windows, iOS, and android devices. You can interact with your reports in the mobile apps by annotating them and sharing them with the rest of your team.
Power BI Report Builder and Report Server
Technically, there are two more elements of Power BI:
- Power BI Report Builder: used for creating paginated reports (reports shaped to fit in pages, i.e., printed papers) for the Power BI service.
- Power BI Report Server: used for creating Power BI reports on your on-premises environment. These reports, when shared, will only be viewed by the other users in viewing mode in their browsers.
While it may look like you can only use Power BI and Power BI service independently, all the elements complement each other so you can get the best out of your Power BI experience.
Power BI’s Building Blocks
You’ll encounter a number of building blocks once you start creating in your Power BI workspaces. The Power BI platform’s major components include the following:
1. Dataflows
When creating reports, you usually need multiple sources of information. Dataflows enables you to unify data from those disparate sources and transform them into a unified data source in your Power BI service.
Essentially, it’s like creating an Excel file to store multiple pieces of information in a single file. You can edit the tables to remove irrelevant ones or add more sources depending on the central information you need.
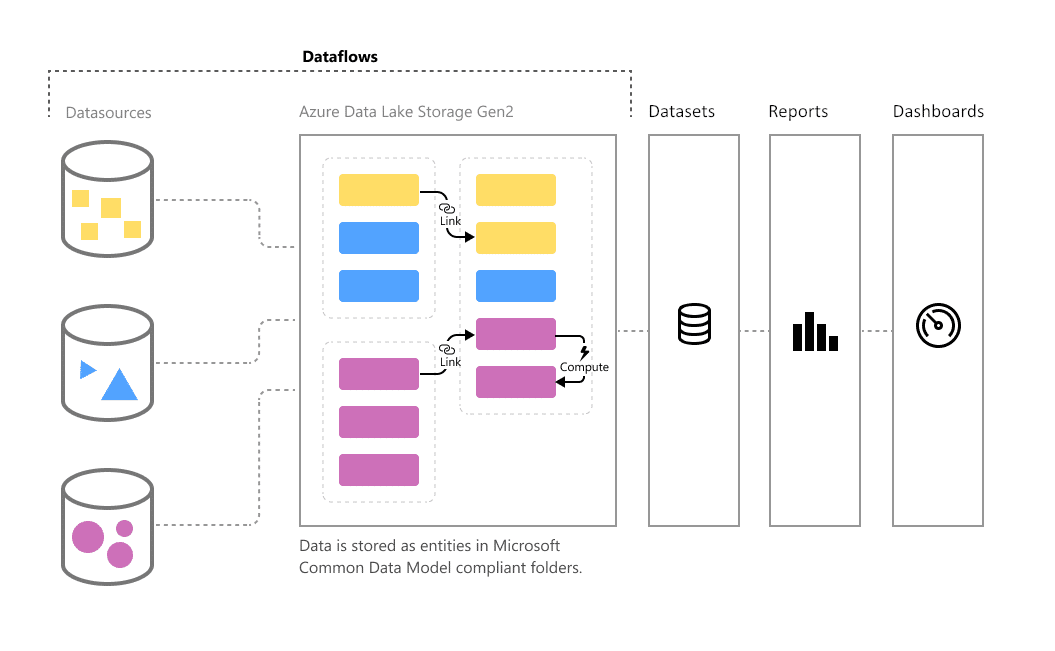
Once prepared as datasets (discussed below), dataflows can now be used to create reports. They can even be reused for multiple reports and refreshed if you need to add or remove additional information.
Analysts (especially those who deal with big data) benefit from dataflows as they can use them to prepare for modeling, transforming, and integrating data by defining source connections, ETL logic, refresh schedules, and more.
2. Datasets
Datasets, on the other hand, are the data source/s that you’ll use to connect or import in your Power BI Desktop and Power BI service. Once you have a dataset, you can create your reports and dashboards.
Your data may come from multiple sources (including dataflows). Still, while a dataflow is editable and refreshed whenever you want, an uploaded dataset can be reused in numerous workspaces and reports while preventing the editing or revision of its contents.
3. Reports
Reports are your page/s of visualizations (aka visuals) from a dataset: line charts, maps, tree maps, and more. You can create reports from scratch or import Power BI pre-built reports when you connect with a dataset from Excel, Power BI Desktop, databases, and SaaS applications.
4. Dashboards
A dashboard is a one-page canvas of tiles and widgets of your pinned reports. While reports can be sliced, designed, edited, and come only from a single dataset, dashboards can only be designed by pinning and unpinning your already-made reports.
You can design your dashboards with different visuals from multiple reports and datasets.
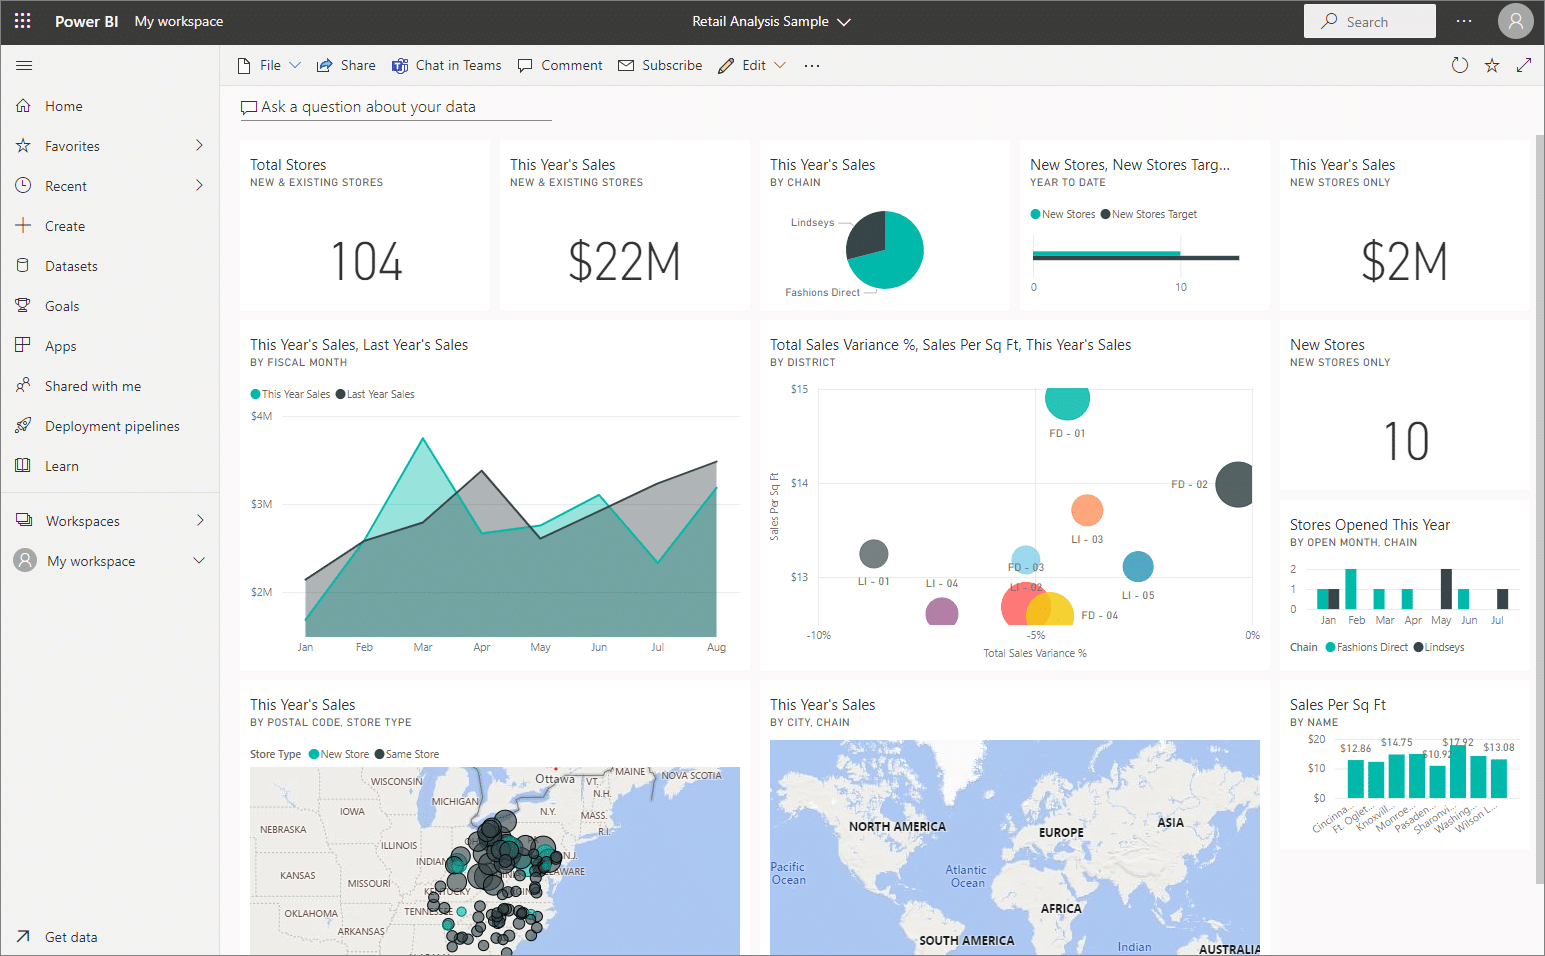
Dashboards can only be created in Power BI service and not in Power BI Desktop.
5. Workbooks
Workbooks are a particular type of dataset. If you upload an Excel workbook to the Power BI service, you can directly pin tables and graphs from the Excel workbook to a dashboard. You can also create reports from the Excel workbook.
Accelerate digital transformation with Power Platform migration.
Explore AvePoint Fly
How to start creating your Power BI reports and dashboards
Now that you know all the essential components of Power BI, it’s time to have an overview of the general workflow in Power BI.
For this example, we’ll be going through a workflow where we’ll create reports on Power BI Desktop and then publish them to Power BI service so we can build dashboards.
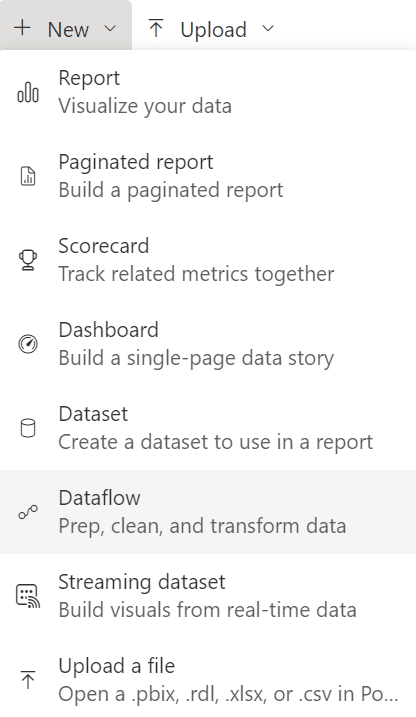
If you first need to create a dataflow, simply choose a workspace on your Power BI service dashboard, select +New, and then choose dataflow.
Once you have your data ready:
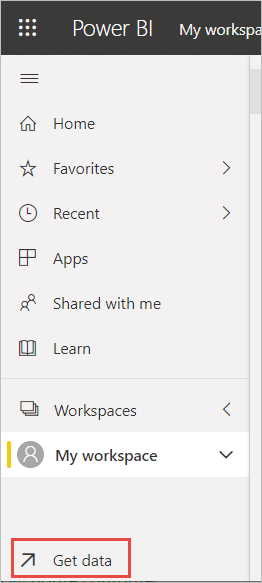
- Connect your dataset to your workspace with the Get data pane in the Power BI Desktop dashboard.
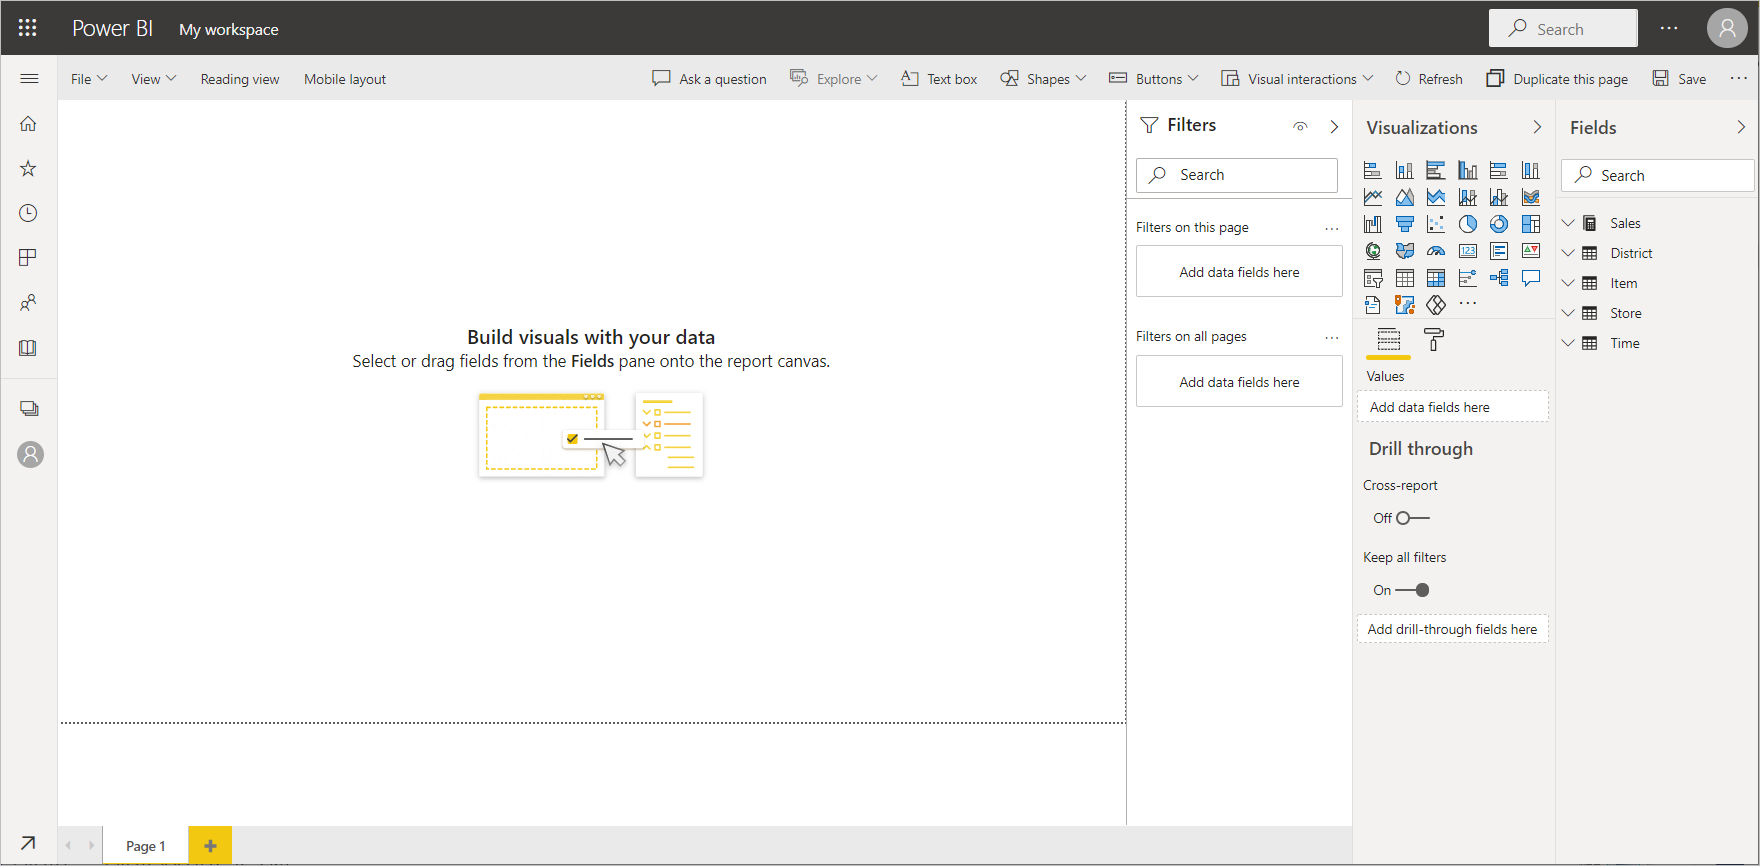
2. Shape your data by creating compelling reports with your data models.
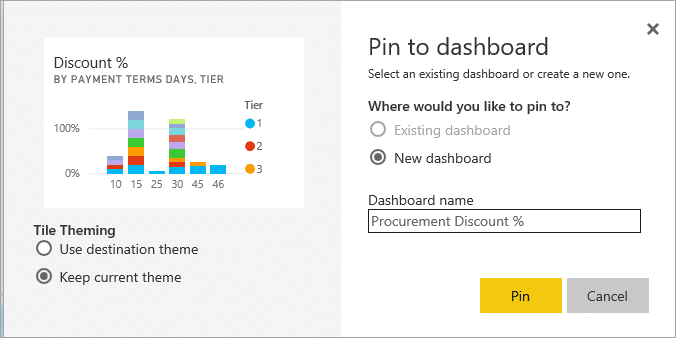
3. Publish your reports to the Power BI service and start building a dashboard. You can pin your whole report to the dashboard or pin tiles from multiple reports. You can also choose from among the various dashboard themes Microsoft provides.
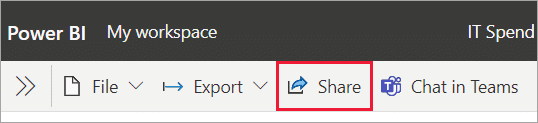
4. Finally, share your reports and dashboard.
Moving forward with Power BI
As you scale your Power Platform adoption, you’ll come across more advanced capabilities to help you better drive business innovation.