
Employee engagement and communication impact the bottom line.
Microsoft’s Work Trend Index Special Report surveyed three million employees at more than 200 companies and found that organizations with the most engaged employees outperformed the S&P 500. In addition, employees at highly engaged organizations are 46% more likely to describe their company as a “strong communicator.”
As organizations embark on their digital transformation journey, they deploy Microsoft 365 and leverage its native insights to comprehend their communication and employee engagement networks.
However, as management demands more concrete data to validate the value of technology deployments, IT leaders often find themselves grappling with insufficient data. How can you prove the ROI of your IT investments? How do you support ongoing internal communications strategies and employee experience initiatives to increase adoption?
The answer: use the right analytics solution based on your use cases.
In this post, we’ll check the differences between two options IT leaders can leverage to understand Microsoft 365 usage: Microsoft’s out-of-the-box analytics and AvePoint tyGraph.
A Tale of Two Workforce Analytics Tools
In a nutshell, Microsoft’s native analytics app, Viva Insights, focuses on personal insights and mindfulness tools for improved work habits. It also includes features that give managers a clear understanding of their team’s work dynamics. For IT leadership, the app offers insights into workplace activities, communication behaviors, and collaboration patterns – all of which can help enhance decision-making and business performance.
On the other hand, AvePoint tyGraph provides a comprehensive overview of your organization’s connections, actions, and productivity beyond what you can see in native Microsoft analytics.
While it can be scoped to personal, manager, and department levels, AvePoint tyGraph allows IT leadership to analyze technology adoption and employee sentiment – all without having to rely on surveys.
Unlike out-of-the-box analytics, where all data is automatically aggregated and deidentified, AvePoint tyGraph allows self-service configurable protection of personally identifiable information (PII). This means PII still helps provide context to organizational insights while remaining anonymized and protected at all times.
Here are the differences between the two tools when it comes to analyzing technology adoption and ROI, employee engagement, and internal communications.
Confirming Microsoft 365 Adoption and ROI
Microsoft’s out-of-the-box analytics focuses more on high-level adoption metrics. It provides a broad overview of usage across different Microsoft 365 tools. This makes it a good choice for organizations that want a quick, easy-to-understand snapshot of their adoption rates.
AvePoint tyGraph provides IT leaders with a long-range perspective of their organization’s Microsoft 365 investment. Gathering analytics on Teams, Viva Engage (Yammer), SharePoint, Exchange, and OneDrive, you can measure active and engaged users over 1-2 years rather than being limited to 90 days.
With a longer and wider range of employee experience data available, IT leaders gain more context into their Microsoft 365 adoption and ROI, allowing them to better support management initiatives, especially digital communications and employee engagement strategies.
Takeda, a global biopharmaceutical company headquartered in Japan, faced the challenge of bringing together the Microsoft 365 (formerly Office 365) and SharePoint data of two companies with 30,000 employees each during their acquisition of Shire. Takeda used AvePoint tyGraph to analyze both companies’ content, identify usage patterns, and track adoption rates post-migration.
“Being able to monitor the whole process really helps us understand what’s happening in our collaboration and communication investments and how users are changing behavior during modernization,” said Dave Feldman, Head of Digital Workplace Delivery at Takeda.
AvePoint tyGraph’s audience segmentation features also give you the ability to filter usage data by group, including division and job title. This feature is made possible by integrating Entra ID and HR data for rich user metadata, allowing for complex audience segmentation.
Digging into user level insights is valuable for adoption change management leaders who need to tailor adoption programs for specific groups within the organization. For example, you found that senior engineers use Viva Engage (Yammer) much less than support analysts. You can extract best practices from support analysts and distill them into a training program to help support engineers raise Viva Engage usage.
Watch our free on-demand webinar and learn how to access actionable data to maximize your Microsoft 365 ROI:

Advancing Employee Engagement
Viva Insights uses aggregated, deidentified data from Microsoft apps and services to map behavioral insights into how people work. It provides department managers with information on their team members’ work patterns – including time spent working after hours – so they can proactively launch initiatives that can prevent stress and burnout. The tool provides suggested actions based on those learnings.
You can supplement the productivity and well-being insights with sentiment feedback directly from employees.
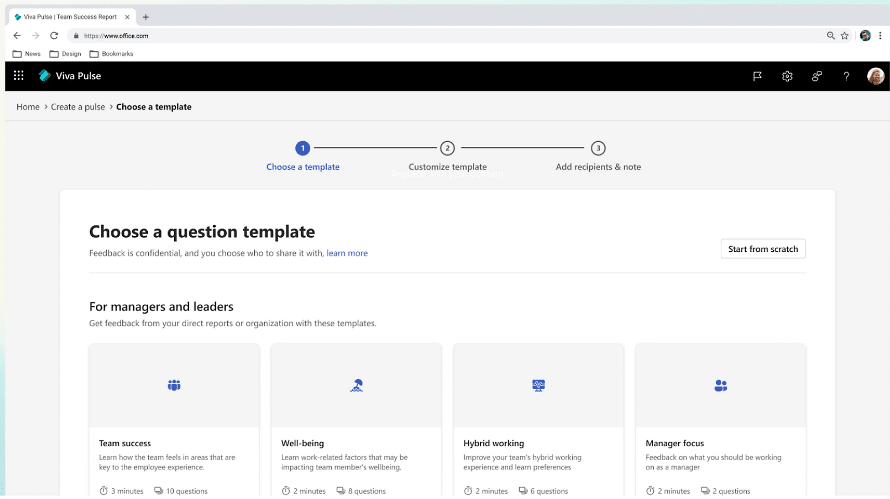
One way to gain employee sentiment data is by using Viva Pulse, another product in the Microsoft Viva suite. Viva Pulse is designed to help managers and team leaders collect feedback on relevant topics by launching short, quick surveys. A self-serve solution that requires no IT intervention to implement, the product uses templates and research-backed questions to get insights into teams’ needs and sentiments, including stress and flexibility.
You can further supplement this feedback with more comprehensive annual employee engagement surveys, but you will need a subscription to Viva Glint to do that. While Viva Pulse allows managers to reach out to their team members on a more regular rhythm, Glint is meant to collect feedback from the top down and on an enterprise-wide scale. It requires administrator configuration and management to run; however, individual managers can still receive aggregated, deidentified data about their team.
While surveys are a common tool for measuring employee engagement, they can be disruptive to everyday operations, especially if conducted often. They’re notoriously unreliable, too. Many employees tend to answer in a way that won’t get them into trouble, or they simply answer quickly just to be done with it.
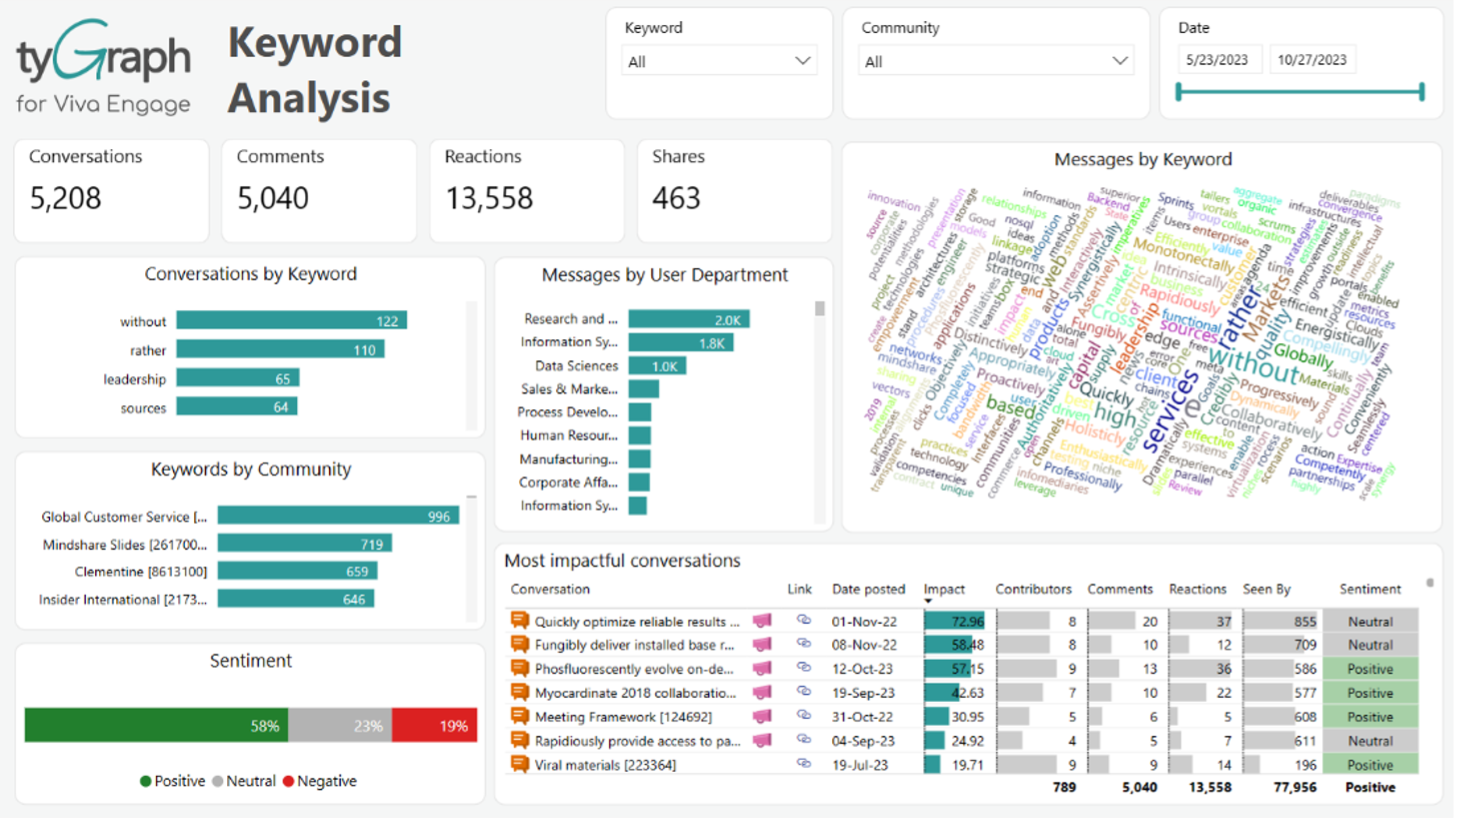
AvePoint tyGraph captures sentiment, keyword, and topic analyses without the need for surveys. It collects engagement signals across Microsoft 365, providing a complete picture of an organization based on actual communications. The solution allows you to track employee sentiments and engagement levels in real-time to allow for pivots and immediate responses, and across a longer period to analyze trends and the long-term impact of employee engagement initiatives.
A leading real estate company with a global team of 20,000+ employees had just replaced their self-hosted intranet with a new cloud-based intranet. “Our previous intranet offered zero analytics, and we couldn’t answer content owners’ questions about if their content was accessed, how it was being used, or even if team members could find it,” a senior collaboration systems director said.
Using AvePoint tyGraph’s advanced analytics and heat-mapping feature, the company tracked high- and low-traffic areas, as well as key metrics like unique users, page views, and page read percentages. With continuous improvements, they achieved an 80% employee engagement rate on the company intranet.
Demystifying Internal Communications
In terms of internal communications, tyGraph shines with its ability to analyze communication patterns within an organization. It can identify which teams are communicating effectively, which ones aren’t, and why. This can help organizations improve their internal communications and foster better collaboration.
Communications teams using SharePoint Intranet can check native analytics to see site visits, unique viewers, average time spent per user, and more. However, you can only view data from the last 7, 30, and 90 days. The good thing is that no additional setup is required from the IT team. Data is available in real-time.
AvePoint tyGraph provides similar analytics but lets you know which files users accessed the most. You can rank your top pages in one view, and filter the ranking based on audience metadata, such as specific groups. You can check the performance of Viva Engage threads and set benchmarks for the success of campaigns.
By holistically analyzing your integrated communications ecosystem, you’re able to see naturally forming information clusters and determine the natural influencers in those groups. With this information, you can leverage influencers and maximize their impact to ensure effective messaging reaches target employees.
A Chicago-based professional services firm, which maintains a global presence with 50,000 employees across 120+ countries, needed to transform their Viva Engage strategy after seeing their engagement rate stagnate at a measly 7%.
Using AvePoint tyGraph, the firm successfully identified Viva Engage influencers and curated their network, leaving only 1,000 high-value communities from the original 5,000. The firm’s efforts resulted in a steady 57% monthly employee engagement rate, representing a 700% improvement from when they started using Viva Engage (Yammer) as an early adopter in 2017.
Which Workforce Analytics Tool is Better?
It depends on your organization’s needs.
If you want a simple, easy-to-understand overview of your Microsoft 365 usage, Microsoft’s native analytics will do. It’s also a good option if managers and team members need productivity and wellness insights that are helpful to prevent stress, burnout, and other concerns that negatively impact employee experience.
If you want detailed, granular insights into your Microsoft 365 adoption, AvePoint tyGraph is the better choice. It offers a level of detail that native analytics doesn’t provide. You can segment your audience based on department, titles, and more while keeping PII protected. With AvePoint tyGraph, you also get to aggregate sentiment from your entire internal communication ecosystem and do it without resorting to disruptive surveys. Plus, you can continuously improve your intranet through insights from heat mapping and content metrics.
And if you want, you can even use them in tandem. That way, you get self-serve solutions for end-users who would like to see wellness information while also providing leadership with critical organizational insights that help drive digital workplace adoption and improve employee experience.
Learn more about AvePoint tyGraph and see how you can turn Microsoft 365 insights into impact.