In the modern workplace, where hybrid work and virtual collaboration have become the norm, digital collaboration tools are the heart of employee engagement. So much so, Gartner predicts that within the next three years, 50% of IT organizations will establish a digital employee experience strategy, team, and management tool.
Despite the increasing investments in workplace technologies and employee engagement, 70% of employees still do not feel engaged. The difficulty lies in knowing how to best utilize these digital workplace investments for your organization, as there is no one-size-fits-all approach when it comes to employee experience.
That’s where advanced insights and analytics come in. Microsoft recently announced Advanced Analytics, a new premium add-on for Viva Engage, at this year’s Microsoft Ignite. As long-time proponents of collaboration and communication insights for Microsoft 365, we were particularly excited to hear about this development.
In this post, we’ll explore how new Viva Engage analytics can drive employee engagement, and how tyGraph for Microsoft 365 can take these insights even further. Through the provision of analytics for all your communication channels, tyGraph completes the picture of employee engagement and gives you the secrets to success.
The Value of Analytics for Digital Collaboration Tools
If digital collaboration tools are the heart of employee engagement, analytics are the lifeblood that keeps it beating, offering crucial insights into how employees are using these tools and how they can be improved to better serve the needs of your workforce. Without these insights, digital collaboration tools turn into static, flat platforms that fail to meet employees’ expectations.
Microsoft Advanced Analytics offers a great starting point to begin tracking performance in Viva Engage, providing information on employee interactions and engagement levels across different communities and conversations.
For example, users can monitor their own engagement metrics through personal analytics, such as the number of posts and reactions received, to track their own progress and identify areas for improvement. Meanwhile, leaders can monitor audience engagement, campaign reach, post reactions, and trending discussions. With this information, businesses can understand how employees are interacting with content and identify opportunities for improvements.
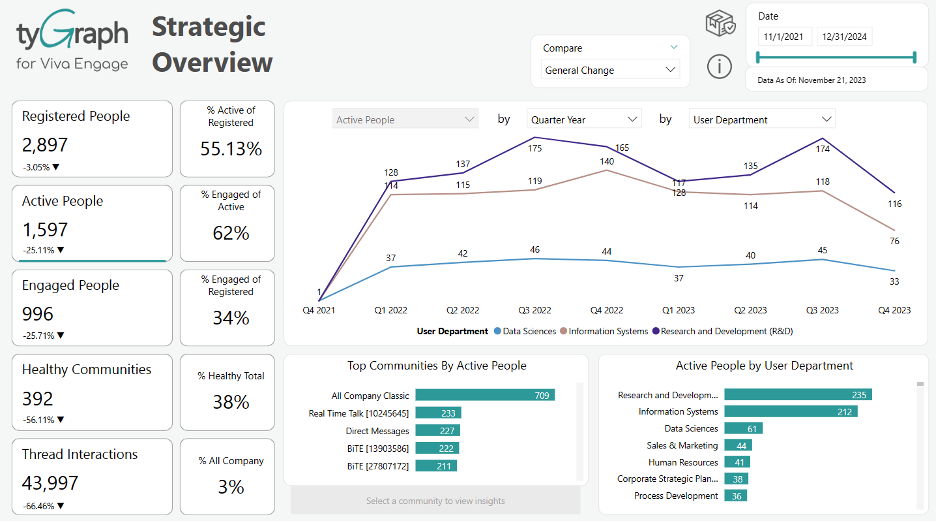
tyGraph for Viva Engage takes analytics a step further, measuring internal discussion around your initiatives — not only where they’re happening and who’s participating, but how it’s impacting your organization — allowing you to track and compare your employee engagement against your overall internal comms strategy. And because tyGraph also details the root causes of the insights it provides, it’s easy to determine what adjustments are necessary to improve your approach.
For example, an analysis on internal communication in both Advanced Analytics and tyGraph might reveal that a new company policy on remote work is rapidly declining. It’s helpful that both tools can identify and offer this insight, but to act on the information, businesses need to understand what’s causing the negative score.
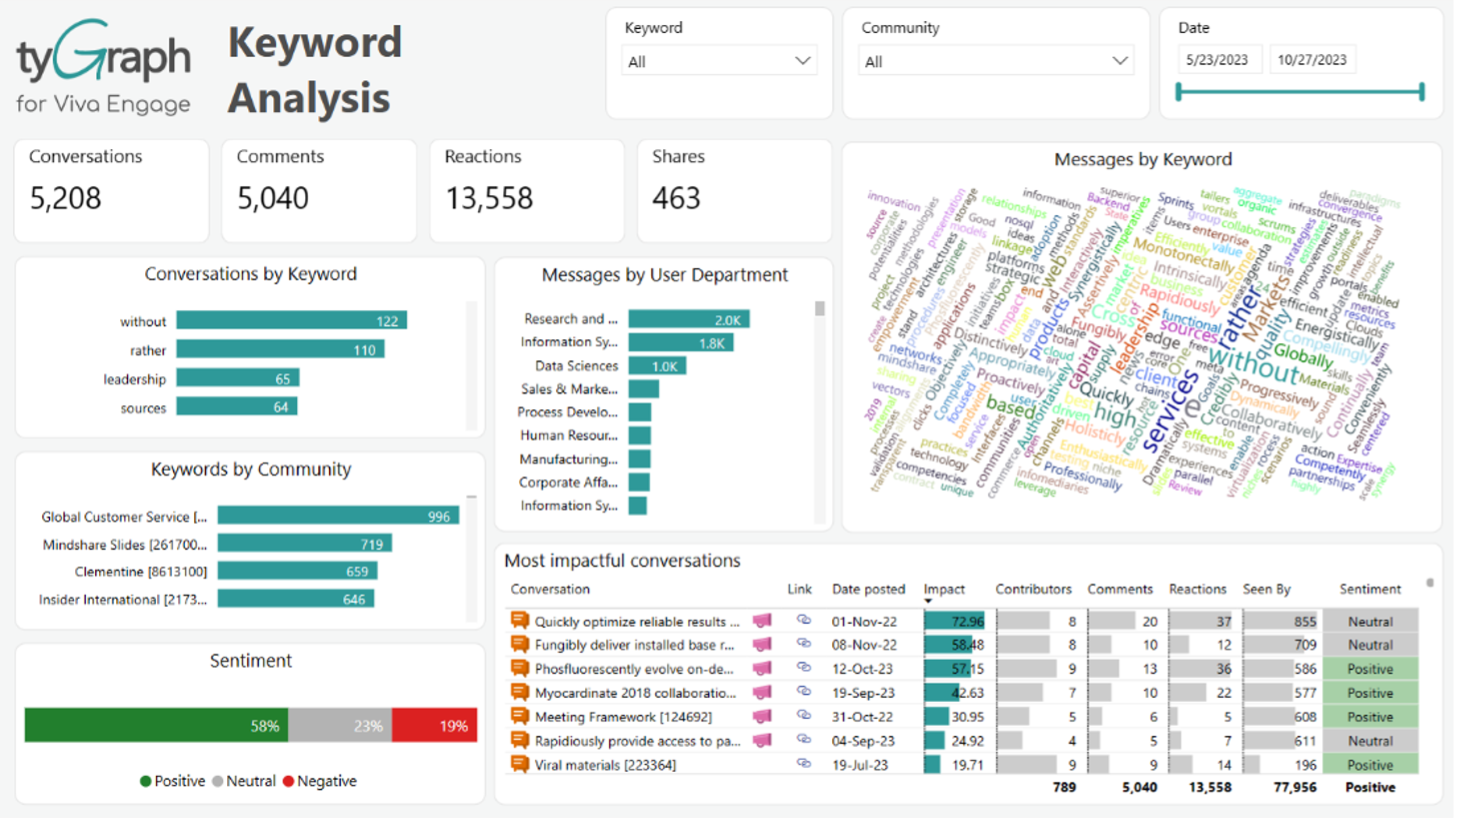
With tyGraph, businesses can dig deeper into why the policy is getting this rating: it filters data by keyword, word usage, topic, or audience to identify patterns. Perhaps further analysis with tyGraph would reveal that the rating is caused by discontent and negative sentiment from the departments the policy disproportionately affects. Armed with this information, businesses can chart a plan forward to make the policy easier on those departments, improve communication around the policy, and ultimately drive better employee engagement and satisfaction.
Best of all, this analysis isn’t limited to Viva Engage, but can be applied across your Microsoft 365 environment to gain a holistic understanding of employee sentiment. This allows companies to better assess the overall health of change management and shape future initiatives based on how employees perceive content.
While both Microsoft Advanced Analytics and tyGraph for Viva Engage can help you measure which conversations, topics, and communities perform best and improve your engagement on the platform, organizations looking for a comprehensive view of their digital collaboration tools need tyGraph’s unique perspective. tyGraph provides deeper insights into internal discussions across all Microsoft communication channels, including SharePoint and Teams, enabling businesses to make data-driven decisions that drive success across the organization.
Maximize Viva Engage and Microsoft 365 with tyGraph
To drive success across their digital workplace, businesses need a deep understanding of their communication and collaboration landscape, including what’s working, what’s not working, and why.
While Viva Engage Analytics can provide some insights, it falls short in providing a comprehensive and actionable solution that goes beyond basic analytics. This is where tyGraph comes in.
With tyGraph, businesses can:
- Track patterns and trends over time: Meaningful insights take time to develop, and to uncover true patterns and trends, businesses need months – or even years – of data. Microsoft Advanced Analytics can track 28 days of conversation and activity. In comparison, tyGraph allows businesses to track communication and collaboration patterns up to three years. This provides a deeper understanding of how the organization operates, easily identifying seasonal patterns, comparing data from different time periods, and uncovering hidden insights that may not be apparent in short-term analytics.
- Segment data by user, group, or topic: No two organizations or departments are the same, and they have different communication and collaboration needs. tyGraph’s integration with Active Directory offers the option to import other HR sources allows businesses to segment data and ground it in organizational context. This enables businesses to identify trending themes based on their audience, community, or keyword, and determine the best approach to engage specific groups. By drilling into these differences, businesses can cater messages to specific user groups and ensure that everyone receives the information they need to know.
- Gain a full picture of communication across Microsoft 365: Conversations happen across all digital workplace tools, and businesses could miss key details if they don’t consider them all. Viva Engage Analytics can inform general patterns about the organization, but tyGraph helps provides a full picture of communication across all Microsoft 365 tools. For example, a product manager’s post on Viva Engage highlighting a new product site may be getting good traction and driving traffic, so it would appear the post is effective. However, SharePoint analytics in tyGraph may reveal users are only spending a few seconds there, indicating a high user churn and that changes need to be made to the site to increase engagement and retention. These insights could easily be missed if relying on in-product insights alone.
By providing deep, cross-product insights, tyGraph helps businesses gain the insights they need to make more informed decisions and drive success across the organization, achieving meaningful and lasting organization-wide change and improving the overall health of the organization.
Watch Now: Unlocking Success in Microsoft 365: Measuring, Delivering, and Deploying Insights

tyGraph in Action: How Advanced Analytics in Viva Engage Improve Employee Engagement
tyGraph for Viva Engage has already helped real businesses improve employee engagement. Take one customer, a global professional services firm that was able to increase their monthly employee engagement rate on Viva Engage to 57%, which is 2x higher than the norm and a 700% increase from where they started before tyGraph.
With tyGraph, the firm’s monthly Viva Engage engagement rate increased from 7% to 57%, a 700% increase
After realizing their engagement rate on Viva Engage had stagnated at a meager 7%, the firm sought to transform the platform from a perceived “noise” platform to a value tool for communication and collaboration. To achieve this, they turned to tyGraph for Microsoft 365 for insights into their Viva Engage communities.
With tyGraph’s usage and engagement rates, they quickly learned that only 20% of their 5,000 communities were active. These inactive communities were making it difficult for users to find active and engaged communities. Based on this information, they implemented structured community audits, requiring users to confirm their communities are still active, and formal onboarding for new community managers.
tyGraph’s content analysis also helped establish best practices for the organization’s use of Viva Engage, such as the most effective topics and frequency of posts. For example, they discovered that:
- well-being initiatives and colleague engagement performed best;
- that 1-2 posts per week for leadership was the optimal frequency;
- and that crowdsourcing was a popular use case for the platform.
Because of the data-driven decisions made based on tyGraph’s insights, the firm is now enjoying reduced clutter and better visibility into high-performing communities, influencers, and content. With employees more engaged, Viva Engage is a thriving environment for collaboration and communication. Next, the firm plans to roll out tyGraph in Microsoft Teams to gain similar insights into their use of that platform.

Get Started: tyGraph for Microsoft 365
There’s a lot at stake when it comes to getting digital employee experience right. A recent Gartner survey of nearly 3,500 employees found that those who report being energized and excited about their work are 31% more likely to stay at their organization, 31% more likely to go above and beyond (discretionary effort), and they contribute 15% more.
That’s why investing in digital collaboration tools and using analytics to elevate them is critical, especially in hybrid work environments. tyGraph, with years of experience in the industry and a deep understanding of Microsoft 365, offers the advanced insights and analytics organizations need, with low-friction dashboards and rich insights for Viva Engage, Teams, and SharePoint, to identify trends, make data-driven decisions, and ultimately drive greater employee engagement and digital workplace success.
To learn more about how tyGraph can help you drive success in your digital workplace, request a demo today.