Microsoft’s latest Work Trend Index report reveals a staggering 68% of people don’t have enough uninterrupted focus time during the workday. The largest productivity disruptor? Meetings took two of the top three disruptors for being inefficient and having too many of them during the workday.
However, we can’t simply do away with all of these meetings. Instead, the focus should be on optimizing the efficiency of meetings and ensuring each call and participant truly contribute to productive outcomes.
To get started, you need a comprehensive understanding of your team’s collaboration patterns. Natively, admins can access some useful Teams meetings and call analytics to troubleshoot call quality and connection problems. But to really get to the root of this problem, you need detailed metrics and context beyond performance. That’s where tyGraph Calling comes in.
What is tyGraph Calling?
tyGraph Calling provides the insight you need to transform how your organization collaborates in Microsoft Teams. tyGraph Calling incorporates signals from Teams Calls, Meetings, PSTN, Direct Calling, M365 Licensing, and your own organizational data to give you a perspective that is contextual to how your company is behaving today. With a tyGraph Calling report, you receive deep insights into how your employees are using Microsoft Teams to communicate through calls, how much time is spent in meetings, and how much money calls and meetings cost your organization.
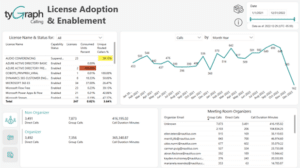
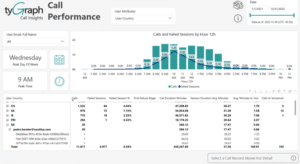
tyGraph Calling reports detailed metrics like Total Call Volume, Unique Participants, Time Spend Analytics and even – drum roll – ineffective calls. Each of these metrics can be broken down into more granular levels with a detailed report page for each, allowing you to really dig into your team’s patterns and begin to plan your improvement strategy.
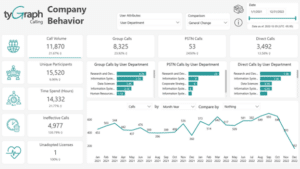
You can use this information to discover trends in your organization’s communication behavior, like identifying regional collaboration styles, measuring external vendor participation, and determining how mature your organization’s Teams adoption is.
The activity logs can also help you identify license usage and wastage through metrics like Unadopted Licenses, where a user may be granted access or actions they do not use. This enables your organization to optimize its IT investments, licensing only those users who need it.

4 Critical Questions tyGraph Calling Answers
Across your organization, from HR to Support, your team is getting questions they can’t answer about how your team works. Unless you manually track each employee’s activity, it’s nearly impossible to begin identifying patterns and trends that could inform these answers.
Now, with advanced analytics on Microsoft Teams meetings and calls from tyGraph Calling, they can begin to put the puzzle pieces together, answering questions like:
1. “What is our team doing with their time?”
We all want to be more productive and efficient. Yet, as we’ve already discussed, meetings overload is real. By understanding how much of their time your team is spending on calls and in meetings, you can determine if they have time to do their work, or if cultural or operational changes need to be made to improve how work gets done in your organization.
2. “Are employees using the tools we pay for?”
You may think your team knows how to use the tools you give them – but do they? With metrics on Microsoft Teams usage patterns, meeting frequency and duration, and even participant engagement – you can understand who is using what and how – helping you identify gaps where additional support or training is necessary. This ensures your organization is making the most of the tools you provide, driving more effective collaboration.
3. “Do we have the right amount of licenses?”
58% of CFOs cite cost optimization as one of their top concerns in the next six months. No organization has money to waste, and it doesn’t make sense to pay for something you aren’t using. Just as critical: ensuring you have sufficient resources to meet demand. There is nothing worse than service interruptions or performance degradation due to high demand during peak usage times. With a better understanding of how your organization is using (or not using) their licenses, you can optimize your budget and resources for the most impact.
4. “How much contact do we have with external users”?
Particularly for highly regulated organizations, understanding who is accessing what and when is critical. This goes the same for Teams calls and meetings – if an unauthorized user is regularly joining calls or meetings and you don’t know them, this should set off alarm bells.
Previously, these questions were not easily answerable. Now, with tyGraph Calling, a simple report can give you a starting point for solving operational inefficiencies (from security to user experience). And we’re just scratching the surface of all you can uncover with insights from tyGraph – discover what other insights you can turn to impact.
How Understanding Microsoft Teams Meetings Metrics Help You: tyGraph Calling in Action
tyGraph Calling has already helped real businesses optimize their operations. Here are two examples of how organizations are using tyGraph Calling to drive their businesses forward:
-
Customer recovered 30% of helpdesk time and improved customer service
A research and consulting firm needed to assess how effective their call center was. They had two primary questions: “Are our customers waiting too long on hold to be helped?” and “Do we have enough (or too many) staff to handle the volume of calls we are receiving?” Unfortunately, these questions couldn’t readily be answered with the information offered natively by Microsoft.
With tyGraph Calling, the firm was able to track the calls coming into the helpline, determine what staff were responding to what calls, and understand call completion rates. With this information, they gained a clear understanding of how the center staff was spending their time, which allowed them to change how the workload was distributed within the team. They were able to recover 30% of their helpdesk’s time, reduce time spent on hold, and reduce calls to voicemail in the first month – all with tyGraph Calling.
-
Customer cut licensing costs by $500k with usage insights
When renewing their enterprise agreements (EA), a food manufacturing company couldn’t get over how much they were spending on call conferencing licenses – it was the third largest item on their EA. Yet they weren’t sure if these licenses were actually being used. Natively, the Microsoft Teams admin center offered a short 30-day snapshot of their usage, but did not address how this usage rolled up to particular users, making it impossible to determine how many licenses were in use.
With tyGraph Calling, the food manufacturing company was able to see which users were using their licenses. tyGraph combined license information with data on Microsoft Teams calls, and the customer learned only 10% of their users were utilizing their assigned conferencing licenses. By cutting these unused licenses, this customer was able to reduce their EA by $500,000.
The Bottom Line
Understanding how your business utilizes tools like Microsoft Teams is essential for improving productivity, adoption, capacity planning, and security and compliance, among other digital collaboration challenges. tyGraph Calling offers insights that can help address these challenges and more.
By leveraging this tool, you not only save valuable time and resources but also enhance employee productivity and satisfaction. Make a significant difference in your business operations by embracing tyGraph Calling and reaping the benefits of improved efficiency, employee engagement, and overall success.