
According to Forrester Research, approximately 6.9 million knowledge workers in the United States will use Microsoft 365 Copilot by the end of 2024.
As more organizations adopt Copilot, IT and digital transformation leaders strive to unlock the full potential of their AI investments and enhance employee experience. Reporting tools will be critical to understanding Copilot adoption and making data-driven investment decisions.
But here’s the catch:
In Gartner’s The Top 10 “Gotchas” of Microsoft 365 Copilot report, the analyst firm said Microsoft 365 Copilot monitoring tools are still in their “infancy.” “Microsoft has made significant improvements, but gaps remain in terms of governance, reporting and administration controls,” the report added.
Here’s why native Copilot analytics tools simply aren’t enough and what you can do about it.
What’s Offered Today: Native Analytics Tools for Microsoft 365 Copilot
Currently, there are two ways to access your Copilot data through Microsoft’s native analytics tools:
Microsoft 365 Reports in the Admin Center
The Microsoft 365 Admin Center provides an overview of your organization’s activities across Microsoft 365 apps. It allows you to drill into individual product-level reports for apps, including Microsoft 365 Copilot. To access it, head to your Microsoft Admin Center and go to Reports > Usage. Select the Microsoft 365 Copilot page.
Microsoft Copilot Dashboard in Viva Insights
Microsoft Viva Insights is part of Microsoft’s employee experience platform, Microsoft Viva. It provides personal and team insights and recommendations to help managers improve their employees’ productivity and well-being. The Viva Insights Microsoft Copilot Dashboard categorizes metrics around Microsoft 365 Copilot readiness, adoption, sentiment, and impact.
In September 2024, Microsoft announced that they will now deliver a free Copilot Dashboard for all Microsoft 365 users. However, the level of feature maturity depends on the total number of assigned Copilot licenses in a tenant.
For example, a tenant with 50 or more assigned Copilot licenses will receive the complete features of a Copilot Dashboard: a readiness page, an adoption page with tenant-level and group-level metrics and filters, an impact page with group-level metrics and filters, as well as sentiment with tenant-level survey results. As for a tenant with less than 50 assigned Copilot licenses, their Copilot Dashboards will compile data at the tenant-level without filters and exclude the impact page.
The two active options provide high-level information on your Copilot licenses and activity with short windows of data retention. If you simply want to see how many licenses are available and how users are prompting Copilot in various Microsoft 365 applications, the Microsoft 365 Admin Center and Viva Insights dashboard have you covered.
In November, Microsoft announced that Viva Insights will now be part of Microsoft 365 Copilot at no extra cost, under the new Copilot Analytics. This includes Copilot Dashboard and Microsoft Admin Center as default experiences.
Copilot Analytics offers customizable reporting for deeper KPI analysis and a Business Impact Report available in public preview. Users can track business metrics, upload them, and view results, showing Copilot's value to teams like Sales, Service, Finance, and Marketing.
To measure Copilot's business impact, users must define a functional business area, outcome metrics, and data sources. The Copilot Scenario Library helps organizations see how different roles can leverage Microsoft 365 Copilot. IT leaders can also compare individual and company-level metrics.
Analysts can upload business metrics into Viva insights via .csv or Azure Blob, then query and determine business outcomes and Copilot usage thresholds. Analysts can also customize reports by toggling data ranges and filters, viewing top Copilot features used relative to business outcomes.
But as an IT or digital transformation leader, you already know that you need deeper insights across your entire organization for long-term analysis and licensing recommendations to maximize your Copilot investment.
Check out our infographic to discover how you can harness the power of Microsoft 365 Copilot for your business:

Areas of Opportunity: Gaps in Copilot Native Analytics
While these updates provide enhanced insights into the organizational impacts of Copilot, these may not suffice to help global companies leverage predictive analyses, longer data retention, HRIS integration, and external benchmarking to maximize the value of license distribution and scale adoption.
Optimize Copilot License Allocation
With all the buzz surrounding AI, Microsoft Copilot licenses are highly sought-after. Whether you’re in a trial or you’ve already purchased licenses and need to scale, how do you determine who you should give licenses to next?
The Admin Center report lists the total number of prerequisite licenses, or the sum of all users with “at least one license assigned to them or who could be assigned a license.” It also includes the number of users eligible to be updated to a prerequisite license. When it comes to existing licenses, both Admin Center and Viva Insights track assigned and available Copilot licenses.
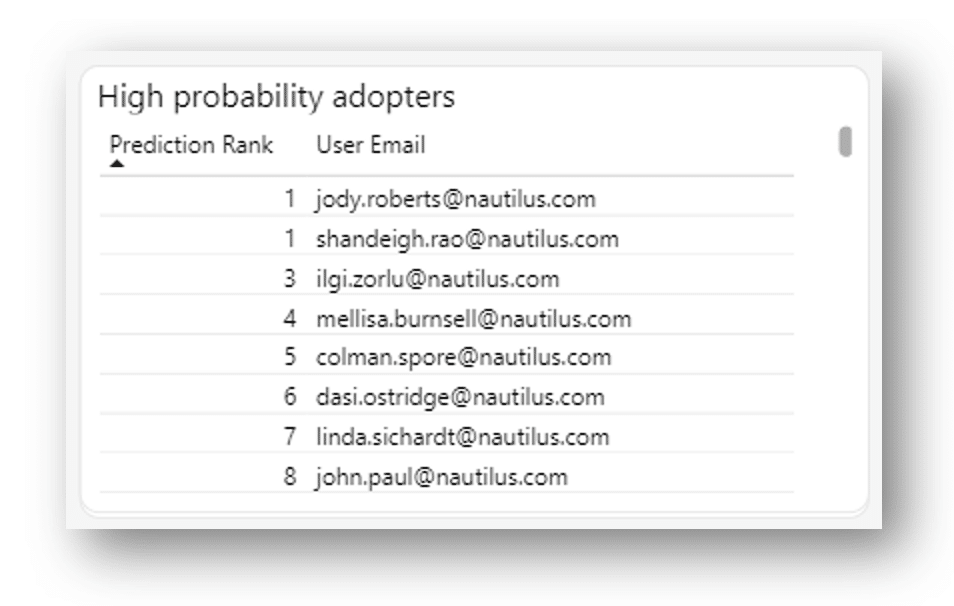
AvePoint tyGraph takes it a step further by providing predictive analysis of Microsoft Copilot licenses. Our analytics identify “high probability adopters” – users who do not have licenses yet but are most likely to succeed with Copilot based on their current Microsoft 365 activity. Once licenses are assigned, you can filter data extensively, allowing you to view licensing trends based on department, title, and other attributes.
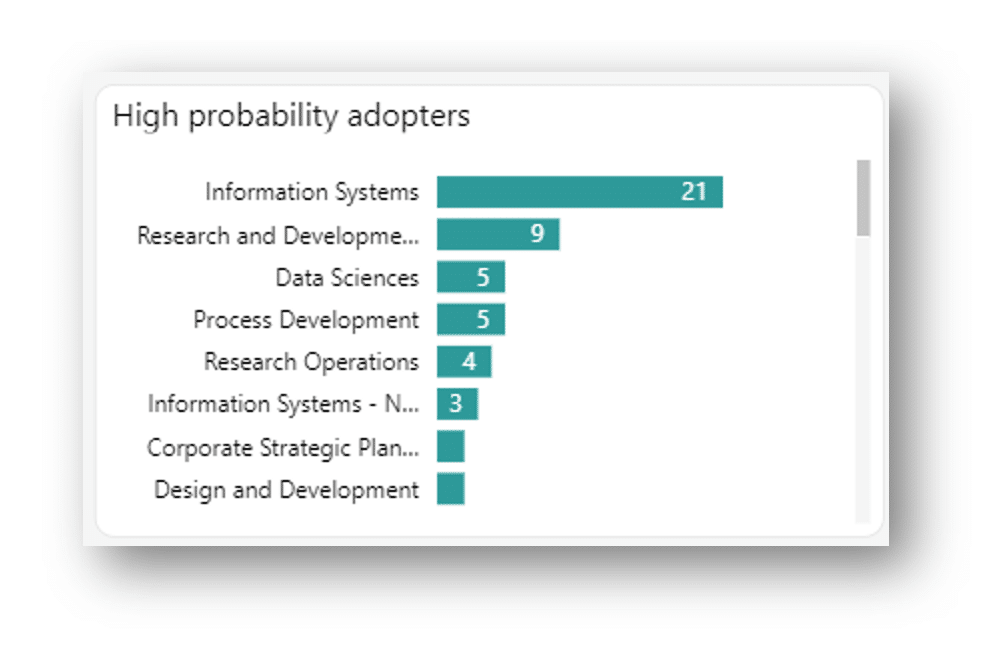
You can also see the departments of high-probability adopters to shape your transformation strategy.
With native analytics, it’s easy to tell how many licenses you can still issue. But with AvePoint tyGraph, you can pinpoint who’s eligible and who’s likely to succeed in adopting Microsoft 365 Copilot. You have data to understand where adoption is strongest, informing your deployment strategy.
Analyze Trends Better with Longer Data Retention
Viva Insights provides usage metrics – user count per application, user count per feature, and actions per user per feature – based on the last 28 days of activity. Additionally, there is an option to compare activity between selected groups of subset users, but there is no ability to obfuscate user information. Admin Center’s Copilot report extends the period to the last seven days, 30 days, 90 days, or 180 days. It also shows the number of enabled users, active users, and the current active users' rate.
Similarly, AvePoint tyGraph shows adoption statistics through the Active Users report. Still, with three years of data retention, it offers more flexibility to compare periods, including general change, month-over-month, and even year-over-year.
Real change takes time, and AvePoint tyGraph allows you to differentiate long-term patterns from sudden growth spikes. For example, AvePoint tyGraph shows the percentage of “one-time users” or users who prompted Copilot just once since the start of data collection. This group represents an opportunity to maximize existing licenses and gain more active users to maximize ROI.
Drive a Sustainable Adoption Framework
Native Microsoft analytics tools can give you high-level visibility into your organization’s Copilot usage, but high activity does not always equate to strong adoption.
For Copilot adoption to be successful, leaders must drive consistency, frequency, and breadth of usage. AvePoint tyGraph gives you a tool to measure and manage your organization’s adoption against that framework.
AvePoint tyGraph features a report on Adopted Users – active users who stay above the “blue line” or the benchmark of our standards of strong adoption. It shows a summary of adopted, active, and non-users by percentage while also breaking down users based on their consistency, frequency, and breadth of Copilot usage across Microsoft 365.
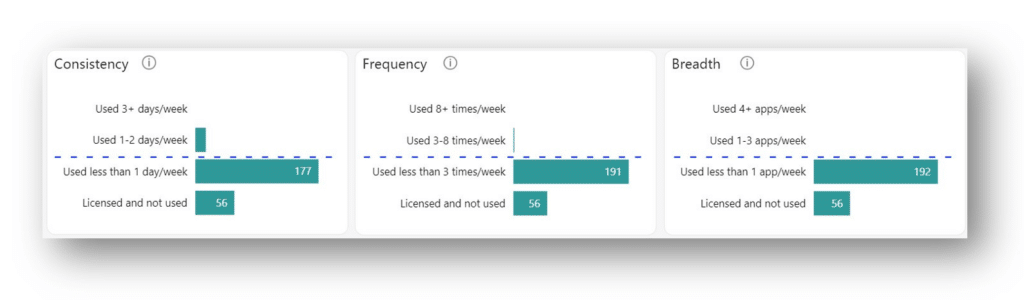
Adopted users, for example, are those identified by tyGraph’s algorithms as having consistent, frequent, and broad interactions across Office applications, Copilot Chat, and Teams. After quickly identifying strong adopters, leaders can then spread their best practices across the organization.
AvePoint tyGraph's capability to pinpoint high adopters who consistently and effectively use Microsoft 365 Copilot not only helps in understanding what high activity looks like but also identifies patterns of productive behavior. Organizing and analyzing human interactions allows tyGraph to pinpoint your organization’s key influencers who can then amplify champion programs.
By turning licensed active users into your productivity champions, you not only promote productive patterns of behavior but also single out where these champions are in your organization, enabling you to make optimal future decisions on how to distribute licenses.
Leaders can also quickly identify strong adopters across their organization and make the best decisions to scale adoption, whether that is building digital programs to re-engage non-adopted departments and users or choosing to reallocate licenses to high-probability adopters. Better yet, all these insights come with flexible data privacy configurations so you can strike a balance between security and usability while making the best decisions to optimize your deployment.
Through this built-in framework, AvePoint tyGraph allows IT and transformation leaders to establish a benchmark and define what “successful and sustainable adoption” actually looks like.
Measure Activity vs. Content Sensitivity and Quality
Do you know if users are prompting Copilot to access your internal, confidential, GDPR, or secret files?
One major opportunity not available through native Copilot analytics tools is the ability to measure activity against content sensitivity. While nothing beats preparing your data for Copilot adoption, admins must still be able to determine which sensitive content Copilot interacts with.
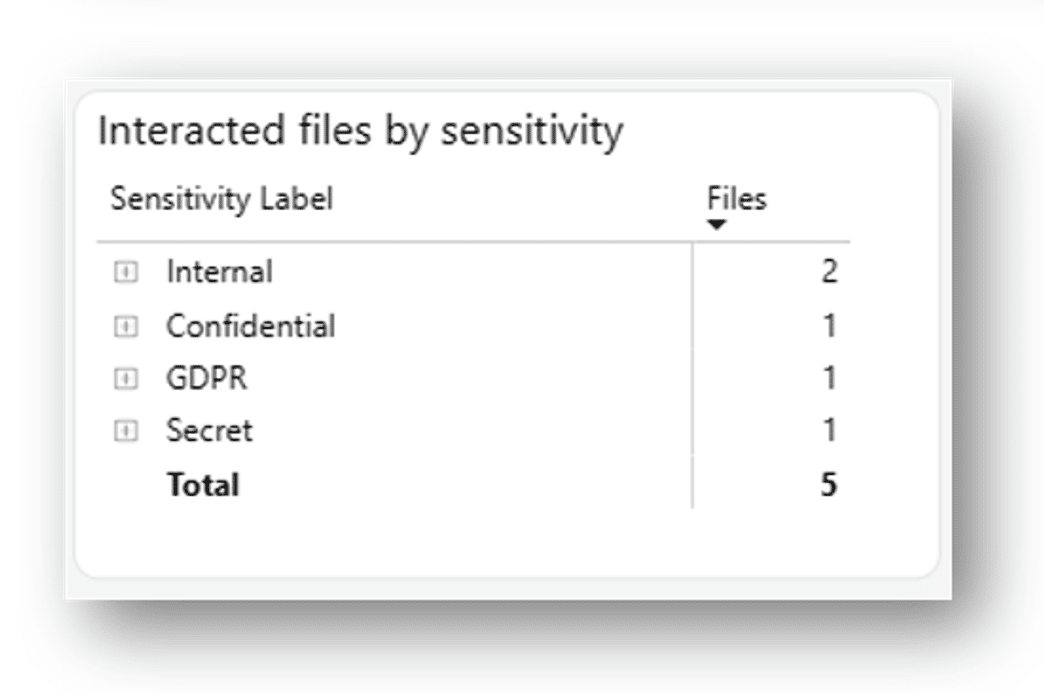
AvePoint tyGraph offers a visual aid to understand the number of files with sensitive labels accessed by users. By expanding the nodes, you can also see which sites these files are accessed from.
This insight into the content Copilot interacts with gives leaders visibility into potential information vulnerabilities and shows them where they should take action to ensure data security.
Find and Support New Ways of Working
You need the ability to filter usage data based on user attributes – including department, title, and region – to make more informed decisions that support increased productivity and other business outcomes.
The challenge here is the effort needed for HRIS support in native reporting tools. While Viva Insights supports HRIS import and the imported data is included in Microsoft 365 Copilot reports, this feature is much more laborious, as it has to be continuously set up, refreshed, and maintained manually.
In contrast, tyGraph has the default capability to pull in user profile information. Before a user profile even reaches the report, tyGraph uses advanced intelligence to clean it up. As a result, a user can dig deeper into an organization’s layers without having to spend hours of support calls, manually importing HR data to segment it by region or department.
tyGraph also allows you to customize your organizational data so that you can go beyond Microsoft's out-of-the-box user profile definitions. You can edit, remove, and build new user segments based off metadata that lives in Entra ID, and create new segments from imported HR data to get a better grasp on user demographics in your reports. Centralizing and customizing user attributes allows you to better understand your users and make more informed decisions for your Copilot program with context from user behavior.
With AvePoint tyGraph, we also connect directly to the source, either in Entra ID or an export link in SharePoint. Each night, we collect it automatically and combine the two. This ability allows AvePoint tyGraph to filter by user attributes deeper than native Copilot analytics tools.
With this feature, you can drill through the most common Microsoft 365 Copilot use cases and do it at relevant levels: user, department, region, etc., and add custom user attributes such as cost center to segment analytics in the most relevant way to your business.
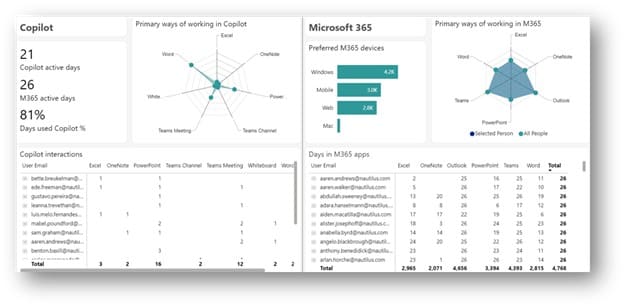
AvePoint tyGraph has another drill-down report comparing Microsoft 365 usage with Copilot usage. When viewed side by side, the radar charts give you visual confirmation of where Copilot is changing business processes and how it’s making an impact on your users’ current workflows. This insight helps leaders identify new ways of working with Copilot so they can support teams as they go through the transition.
Maximize Your Copilot Investment with AvePoint tyGraph
While Microsoft’s native analytics tools for Copilot provide a basic level of insight into usage and adoption, they may not be sufficient for organizations seeking to fully leverage their AI investments. The limitations in data retention, granularity, and the ability to filter by groups or attributes can hinder long-term analysis and understanding of usage trends.
As Gartner suggests, organizations must consider other mechanisms to determine the value of Microsoft 365 Copilot. AvePoint tyGraph is one such mechanism, providing the detailed insights and predictive modeling necessary to maximize your Copilot investment.
Of course, the option to create custom reports is always available. However, audit logs are still limited to 180 days of retention. And while analysts can now upload their business metrics and produce a customized report, native tools still lack depth in data retention and predictive analysis. With only short-term data views and limited user attribute filtering, native tools may hinder long-term strategic planning and comprehensive adoption measurement.
AvePoint tyGraph, on the other hand, offers a more comprehensive solution that’s already built for you, delivering more detailed insights, better predictive capabilities, and external benchmarking, making it essential for optimizing and scaling Microsoft 365 Copilot adoption. You can use it from the earliest stages of adoption, even during your Copilot trial period – which is critical in informing licensing decisions and allows you to maximize your investment right from the get-go. It doesn’t only measure data, it drives digital maturity through a sustainable adoption framework that accounts for consistency, frequency, and breadth of usage.
AvePoint tyGraph identifies high-probability adopters based on their current Microsoft 365 activity, provides longer data retention for better trend analysis, and allows for a more detailed understanding of user adoption. Furthermore, it offers insights into the sensitivity of content accessed by Copilot, helping to ensure data security and uphold the quality of information generated. AvePoint tyGraph also supports HRIS integration, allowing for deeper filtering by user attributes than native Copilot analytics tools.
Finally, for business leaders and executive management who want their organization to gain a competitive edge, AvePoint tyGraph offers external benchmarking. Opting in to tyGraph’s external benchmarking program enables executive leaders not only to discover what good adoption looks like but also to set realistic performance targets for their continuous growth. With an eye on how their Copilot adoption stacks up against those of global organizations, executive management can make informed decisions on their deployment strategy and ultimately maximize the value of Microsoft 365 Copilot.
To learn how to execute a sustainable, wide-scale deployment of Microsoft 365 Copilot across your organization, read our free eBook today.


Grace Harrison is a Product Marketing Manager at AvePoint, Inc., based in Jersey City, NJ. She works in the Product Strategy department, contributing to solutions like AvePoint Cloud Backup, AvePoint Fly, and AvePoint tyGraph. Grace plays a key role in developing marketing strategies and competitive intelligence to support AvePoint's field teams and enhance their selling tools.