

Technology trends
I love the idea that we are (especially people working on Office 365) surfing on technology trends to help our customers and companies do their best. It’s also a great imperative in order to never be trapped in old or outdated technologies where employability will be bad (at least). It is the same for our customers trying to get the right set of tools to have the work done at the end of the day.
Check out our upcoming webinar, “Bots, SharePoint Customizations, and Office 365 Workflows, Oh My!”

So from year to year, we always test a variety of new products and services in a constant search for improved productivity. Sometimes we adopt new tools that change the way we work. This is especially true in the domain of collaboration tools, and I think the big waves of transformation seen in the past years are not better displayed than in “Estimated Level Of Enterprise Interest Over time” graph published in Dion Hinchcliffe’s article “Seeking a Modern Foundation for the Digital Workplace”.
The great thing about the depicted trends here is that they can be precisely mapped to Microsoft tools and trends we have experienced in the past. For example,
| Functional trends | Corresponding Microsoft tools |
| File Servers and drive shares | Windows file servers |
| Corporate E-mail | Exchange / Outlook |
| Unified comms | Lync and Skype |
| Portals, Intranet | SharePoint |
| Content & Document Management | SharePoint again |
| Enterprise Social networks | Yammer |
| Resurgence of file sync & sharing | OneDrive |
| Team Messaging | Teams |
| VR & AR | Hololens |
But we can ask: What will be the next waves of innovation in the Office 365 product set?
To answer this question, we should first go to the Office 365 roadmap site, the purpose of which is to list all incoming improvements on products in the suite.
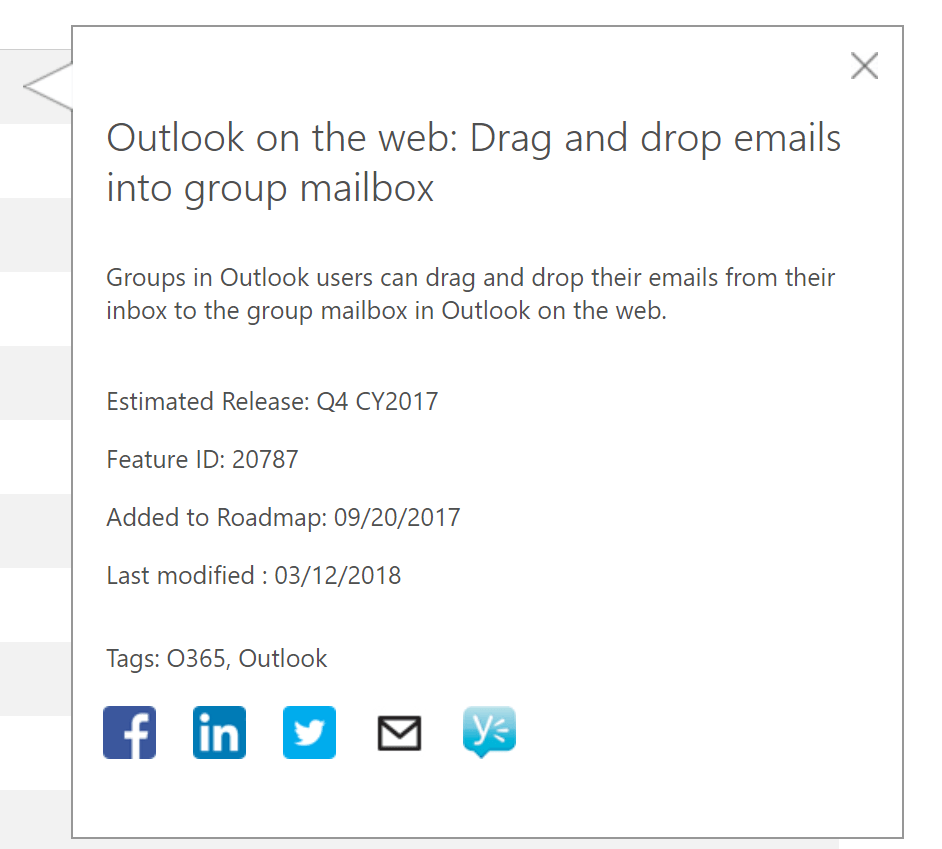
But despite very precise and accurate information present on this site, it’s really hard to get an overview of where Microsoft is investing in the next months or quarters. It’s also difficult to tell which products currently get the most investment in development teams and which ones will probably be most important in the next months and years.
Here’s where Power BI can be of great help. You can download a spreadsheet version of the roadmap and then manipulate it more easily. The following analysis is based on the Office 365 Roadmap Excel file as of March 15, 2018. After quick transformations in Power BI, here is a first simple view of the number of features currently under development or recently released.
Step 1: Raw figures analysis
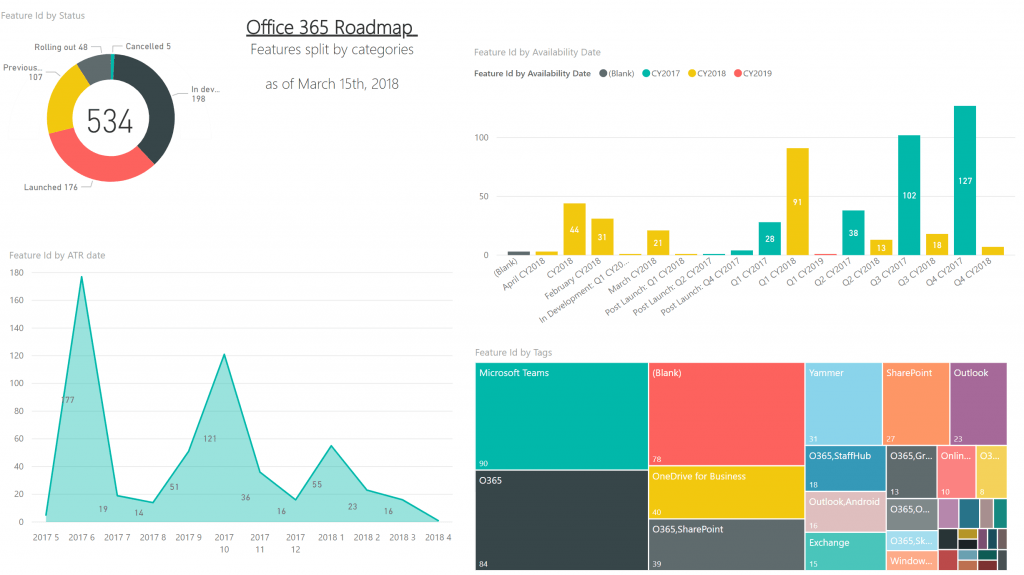
On this display, we can already see interesting things:
- The development effort on Office 365 is really impressive, with more than 500 new features planned and added to the roadmap in the last few months.
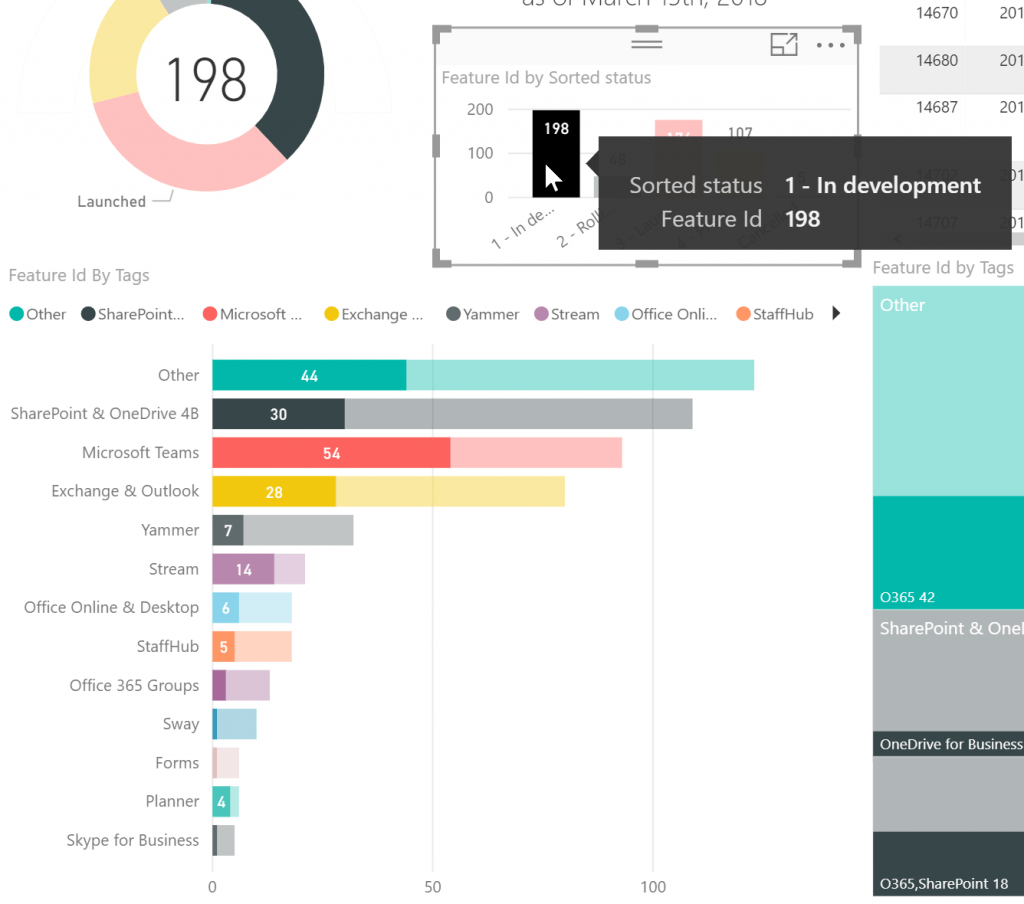
- Among the 534 features listed,
- more than 100 (20%) have already been released,
- 176 (33%) are launched,
- 48 (9%) are rolling out,
- 198 (37%) are still under development
- only 5 (less than 1%) have been cancelled once added to the roadmap.
- There is a clear quarterly peak in activity, most of the features have been added to the roadmap in June 2017, October 2017, January 2018.
- Not sure if this is a long-term trend, but there is a decreasing number of features added from quarter to quarter.
- The planned availability dates for the features are not easy to analyze, as there is not a homogeneous way to describe planned availability dates. For example, we have: CY2018, February 2018, March 2018, “Post Launch: Q1 CY2018”, “In development: Q1 CY2018” which can all relate to the same period. We will have to do some adjustments to be able to analyze these figures more precisely.
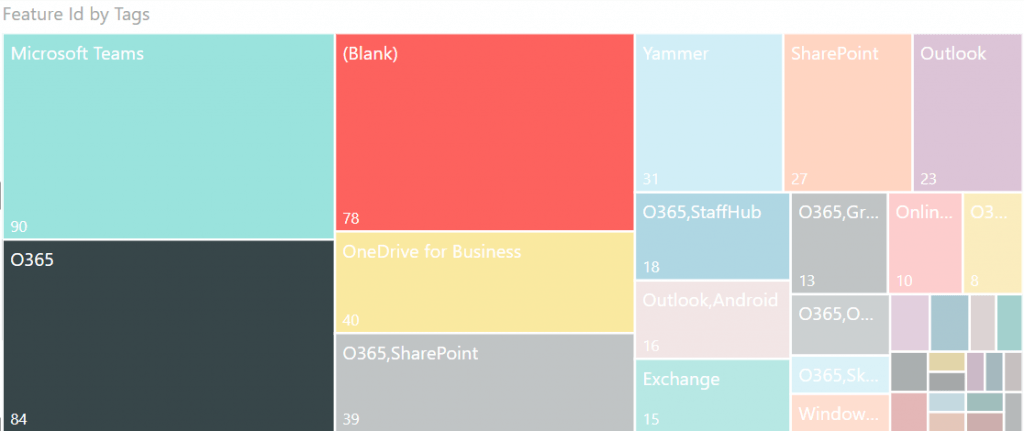
- Unsurprisingly Microsoft Teams is the first tool by features planned with 90 new features planned. However, the second and third category are much less significant with “Office 365” and “blank”. The following tags in the list are: OneDrive for Business, “O365, SharePoint”, Yammer, SharePoint, Outlook.
Step 2: Breakdown by deployment stages
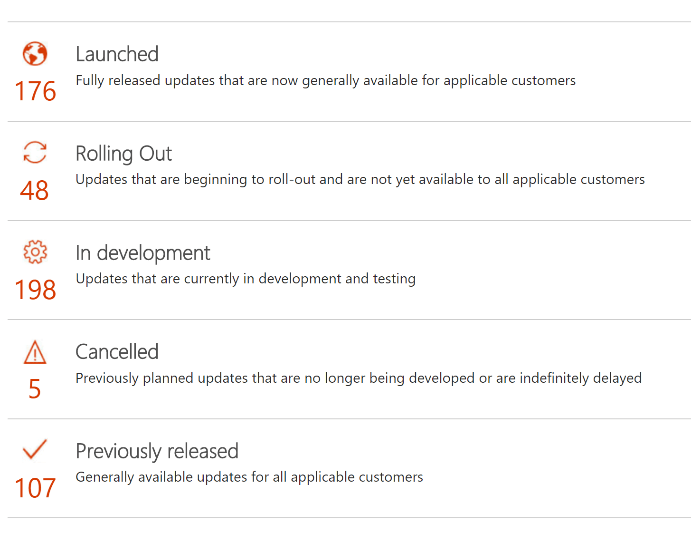
So let’s continue our analysis by first reminding you of the states of features in the roadmap:
 To be clear, the Office 365 roadmap is only the final stage from a feature idea to being added to Office 365. UserVoice sites by products providing a first step, allowing rich interactions between product teams and end-users:

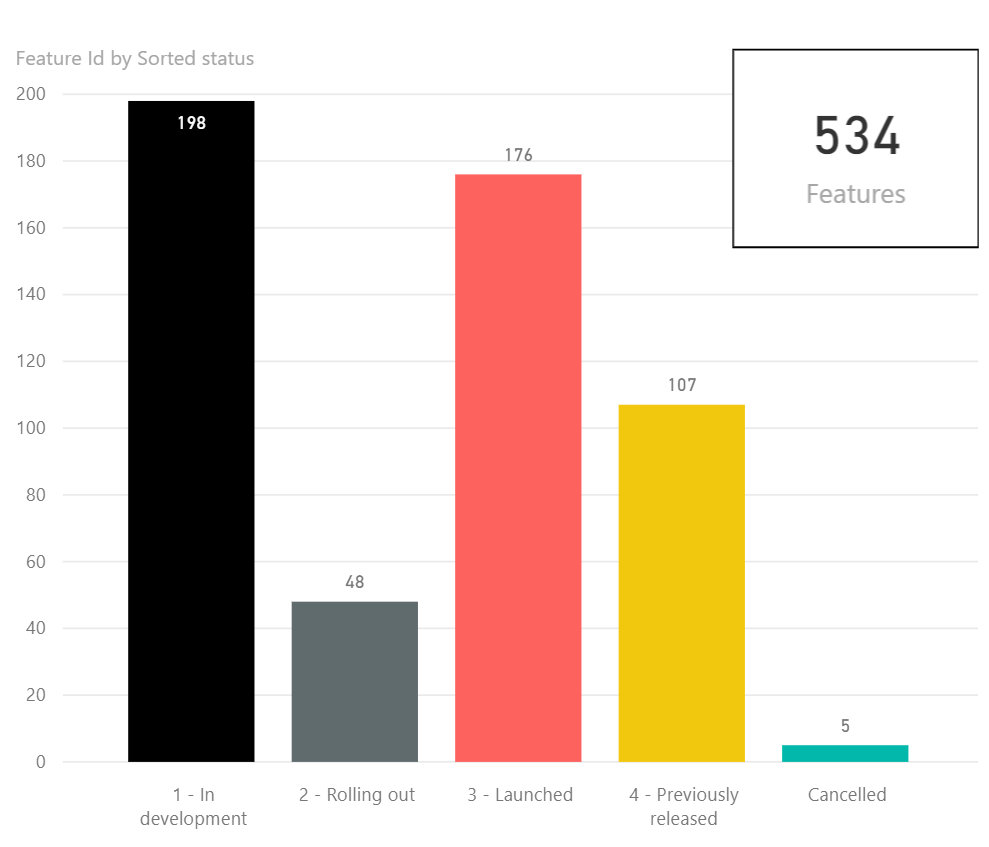
Here is the current features breakdown by stage:
With PowerBI, it’s easy to analyze stage breakdown for a specific product. Here’s the dashboard filtered with tag “O365, Groups”:

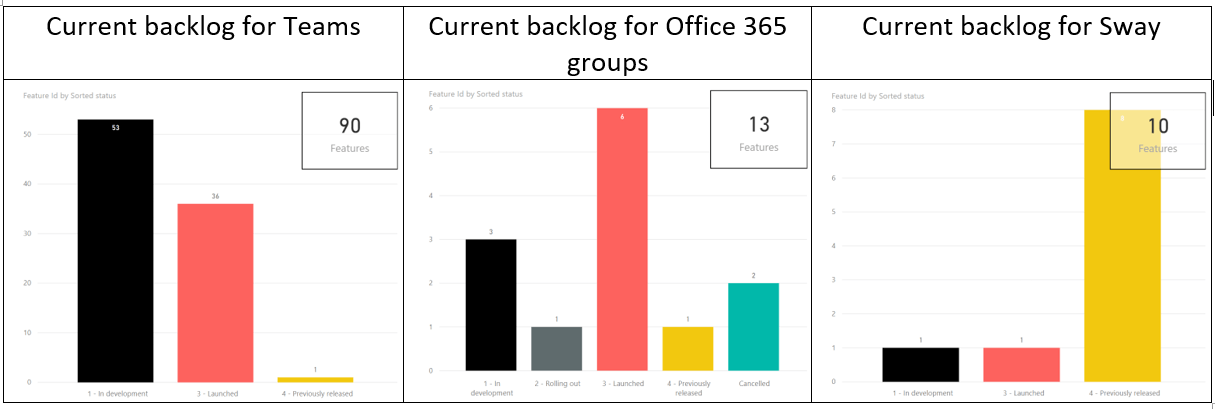
We can see easily here that launched and previously released features outpace features in dev, which is a sign of the product entering the maturity phase. In this regard, it’s very interesting to compare (from left to right below) the state of Teams (still in a development burst) versus Groups (already entered in a maturity phase) and even Sway (with almost no new dev planned):
Step 3: Breakdown by tags, aka products
Let’s now explore the breakdown of features by tag. In the original schema, it’s striking that blank and generic “O365” tags are among the top 3 biggest categories. It’s also clear that some cleansing can be done. For example, you can aggregate similar categories like “O365, SharePoint” and “SharePoint”.
Another obvious cleansing is, for example, Stream features are not tagged (they appear in the blank category), so I made the necessary updates.
I also created groups of tags to gather related tags together (for example Exchange and Outlook). The results of these improvements can be seen below:
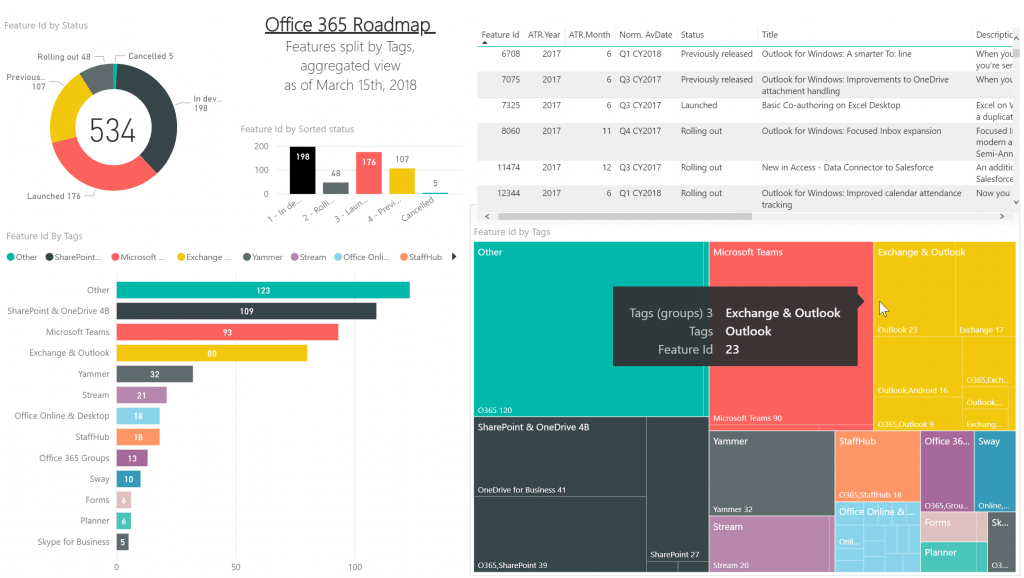
Below is the resulting order of Top 5 products by number of features. If you only take features under development into account, the ranking is slightly different, and Teams is once again number one.
| Top 5 all features included | Top 5 considering only in development features |
| Core Office 365 (Other) | Teams (54 features under dev) |
| SharePoint and OneDrive FB | Core Office 365 (44 features under dev) |
| Teams | SharePoint and OneDrive FB (30 under dev) |
| Exchange and Outlook | Exchange and Outlook (28 features under dev) |
| Yammer | Stream (14 features under dev) |
This clearly establishes the top priorities of Microsoft dev teams in Office 365.
It’s also interesting to note that Power BI, Flow, and PowerApps updates are almost not present in this picture, as these products are more linked to the Dynamics dev teams.
Step 4: Breakdown by estimated availability dates
We can now use product meta-categories created in step 3 to characterize estimated availability dates.
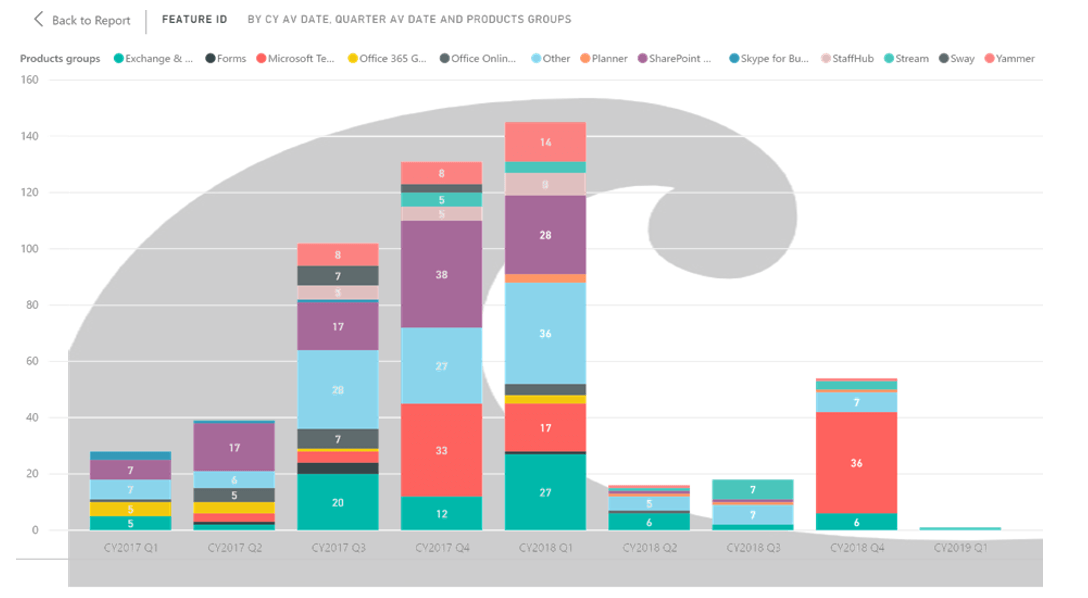
It’s interesting to see the big wave of innovation we had up to Q1 CY2018! In this aspect, fewer new features are planned for the next part of the year, but that could change.
It should be noted that these availability dates are estimated and are not updated in the roadmap. For example, Microsoft To-Do reached GA much sooner (October 2017) than previously stated (Q2 CY2018):

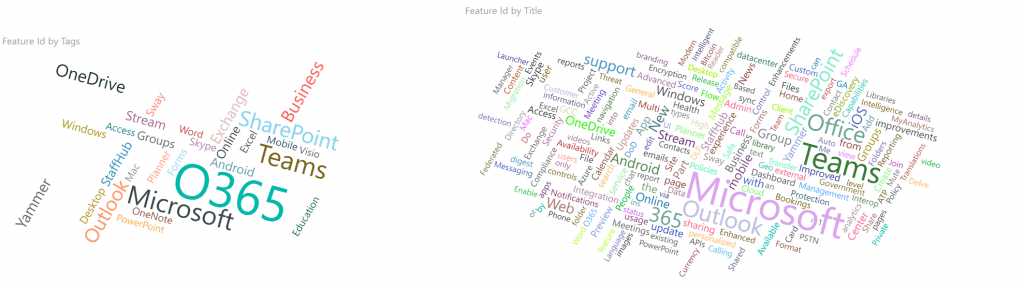
Step 5: Word Cloud filtering
To end this analysis, it’s easy to add a word Cloud visual component in PowerBI and to use it to filter features either on the title field or on the tag field.
Here are the full word clouds. On the left is the word cloud generated from the tags, on the right is the word cloud generated from the title field.
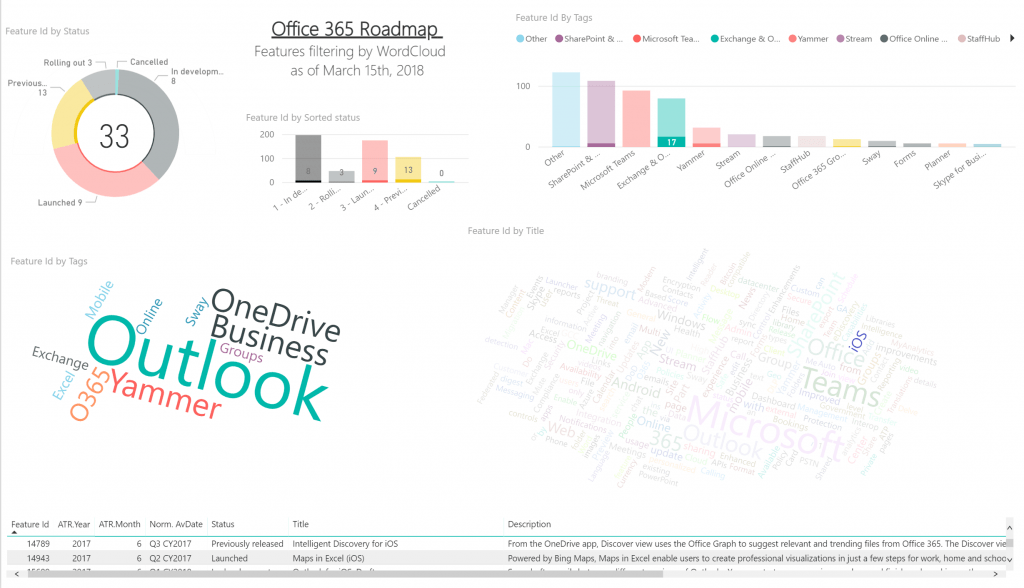
Using this component, you can quickly filter all planned features containing “iOS” in their name. Here is a screenshot of the result:
Conclusion
I hope this has given you a few insights on the Office 365 roadmap. If you want to explore the dataset yourself, you can play with it by going to the following URL. Also, for this post in French, click here.
Enjoy your surf!
Like what you read? Be sure to subscribe to our blog to stay in the fold for all things Office 365, SharePoint and more!


Wow, that was brilliantly done! So shared!!
very clear and good article easy to understand. Thank you